
- BTC bullish momentum to continue as pointed out by Technical Indicators.
- Bitcoin price has increased by 0.02% in the last 24-hours
- Bitcoin has resistance level of $16,885.74.
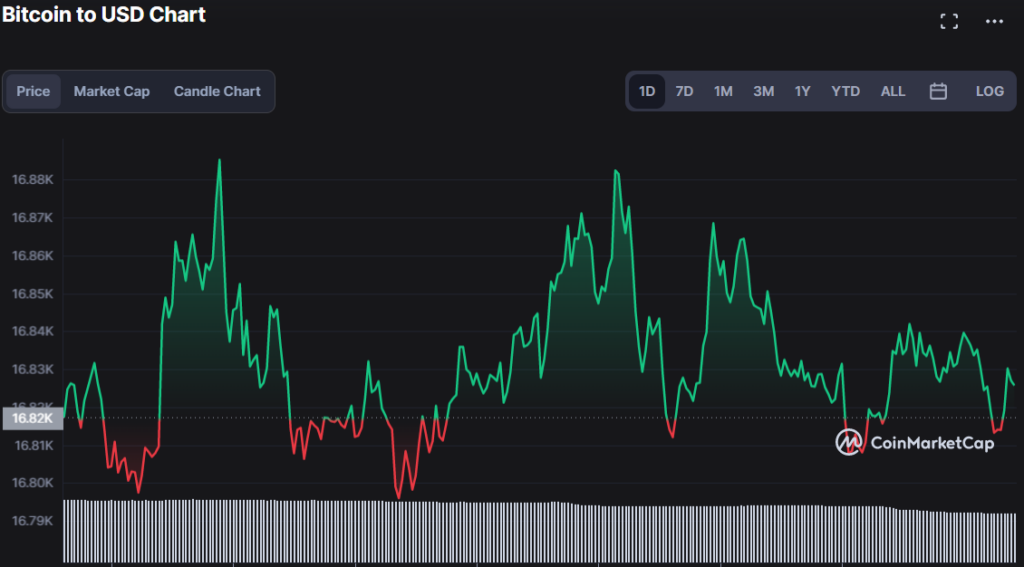
In the previous day, bulls established a resistance level at $16,885.22 and a support level at $16,792.99. Bulls continue to exert pressure on the Bitcoin (BTC) market, and the price is still in a bullish trend.
BTC is currently trading at $16,828.25, a 0.02% increase. This bullish momentum has been bolstered by an increase in market capitalization, which has increased by 0.02% to $323,575,765,661.
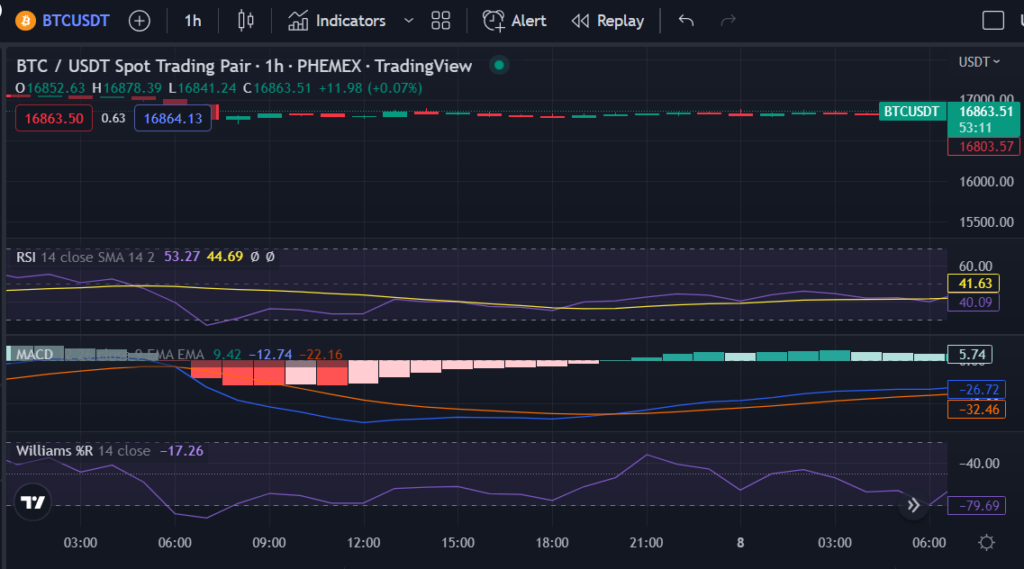
This bullish market condition is backed up by the Relative Strength Index (RSI), which is moving above the signal line in the 1-hour price analysis of BTC, indicating that the bullish momentum might likely continue and the BTC price may likely reach new highs. The RSI indicator is at 40.09, which means that buying and selling pressures are in balance, though buyer pressure appears to be greater than seller pressure because the RSI line is pointing north.
As evidenced by the Williams Percent Range (William%R) indicator, which currently has readings of -79.69, bulls are pushing the Bitcoin price higher as the Willi %R is moving towards “0,” indicating that bulls have taken control of the market; therefore, investors and traders may expect to see this bullish trend continue in the near future.
The MACD (blue) line is also above the signal line, which is currently at -26.72, indicating that the bulls are in charge of the market as they push BTC price towards the northern territory. This bullish momentum is also supported by the trajectory of the histogram in the positive area, with readings of 5.74. This means that the bulls’ influence on the market may continue to grow.

The Chaikin Money Flow Indicator is currently showing a value of -0.11, but it is pointing up. This shows that the bulls are in control of the market because they are pushing BTC prices to the “0” region. This means that there are more buyers than sellers on the BTC market, and that bullish momentum may continue in the future.
The stochastic RSI, which is currently at 58.89, is getting close to “80,” which is the point at which a stock is considered “overbought.” This means that bulls are getting stronger and buying and selling forces are becoming equal. This stochastic RSI movement gives traders hope for a bull run.
Finally, as evidenced by the technical indicators, a bullish momentum is expected to continue, potentially resulting in Bitcoin setting new highs in its price.
Read Also:
disclaimer read moreCrypto News Land, also abbreviated as "CNL", is an independent media entity - we are not affiliated with any company in the blockchain and cryptocurrency industry. We aim to provide fresh and relevant content that will help build up the crypto space since we believe in its potential to impact the world for the better. All of our news sources are credible and accurate as we know it, although we do not make any warranty as to the validity of their statements as well as their motive behind it. While we make sure to double-check the veracity of information from our sources, we do not make any assurances as to the timeliness and completeness of any information in our website as provided by our sources. Moreover, we disclaim any information on our website as investment or financial advice. We encourage all visitors to do your own research and consult with an expert in the relevant subject before making any investment or trading decision.