- Bitcoin (BTC) was the first blockchain currency.
- In the end of 2019 BTC market closed at $7,200.
- $19,030.09 is the new BTC highs in the year 2023.
Bitcoin (BTC) was created in 2008 as a peer-to-peer (P2P) version of electronic cash that would allow online payments to be sent directly from one person to another without going through a bank. It does this by using blockchain technology, which is a decentralized ledger of all transactions.
Bitcoin’s creators, who went by the alias Satoshi Nakamoto, remain a mystery. The first block, referred to as the “genesis block” of Bitcoin (block zero), was mined on January 3, 2009, creating the first 50 Bitcoins. On January 12, 2009, the first Bitcoin transaction was completed.
Rally in 2019 and 2023
Beginning 2019 with a bearish sentiment, Bitcoin’s market was still unsure of where it was headed. It flirted with $4,000 for the first few months, then broke through in April before shooting up to $5,000. According to a post on Reddit, the price of Bitcoin experienced a 75% price increase in just three weeks, from June 9th, 2019 to June 26th, 2019, when it went from $7788 to $13k. During that same month, Bitcoin’s price suddenly skyrocketed to $13,000 before settling back down. Bitcoin’s value had dropped below $7,200 by the end of 2019.
On January 1st, 2023, the BTC market started trading in a bearish trend, where it was trading at $16536.55 with a 10.87 billion trading volume. Since then, bulls have tried to intervene in the market, where they have pushed prices to $18,808.77 in the last 24-hours, which is a 3.51% price increase. According to CoinMarketCap data, in the last 7-days Bitcoin has recorded an all time highs of $19,030.09 and all-time lows of $16,716.42.
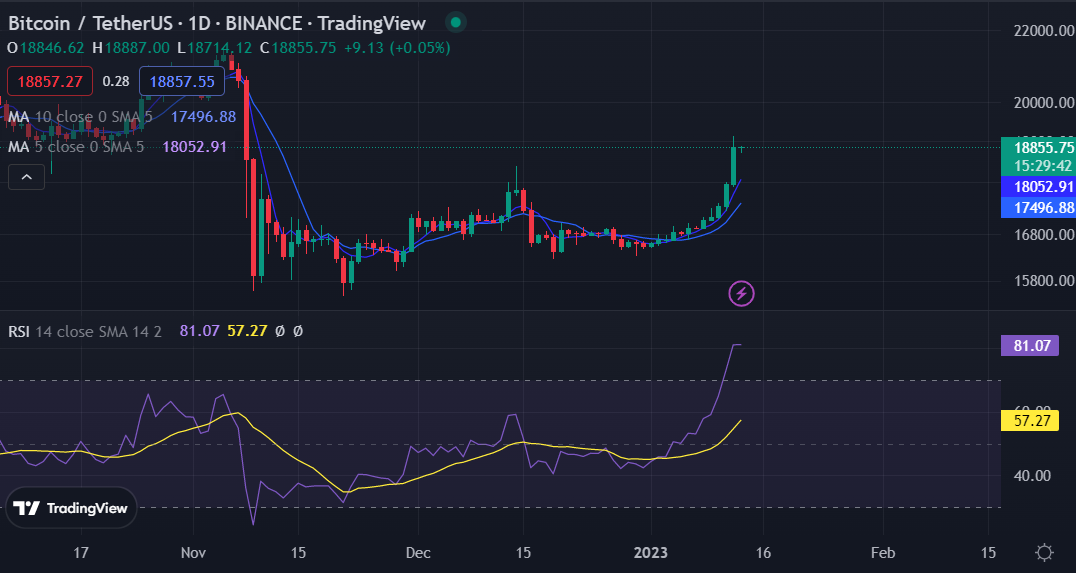
Recent BTC Technical Indicators
The latest BTC technical analysis shows that bulls are driving the BTC market. The 5-day Moving Average (MA) is currently higher than the 10-day MA, pointing to the possibility that the current bullish momentum in the BTC market might very well persist into the immediate future.The current levels of the 5-day and 10-day MA are 18046.19 and 17493.08, respectively.
The RSI line is also indicating that BTC market is in the hands of bulls, as it is moving above its signal line (yellow), indicating that Bitcoin market is in a bullish sentiment and that this trend might continue in BTC market in the coming hours.
Read Also :
disclaimer read moreCrypto News Land (cryptonewsland.com) , also abbreviated as “CNL”, is an independent media entity — we are not affiliated with any company in the blockchain and cryptocurrency industry. We aim to provide fresh and relevant content that will help build up the crypto space since we believe in its potential to impact the world for the better. All of our news sources are credible and accurate as we know it, although we do not make any warranty as to the validity of their statements as well as their motive behind it. While we make sure to double-check the veracity of information from our sources, we do not make any assurances as to the timeliness and completeness of any information in our website as provided by our sources. Moreover, we disclaim any information on our website as investment or financial advice. We encourage all visitors to do your own research and consult with an expert in the relevant subject before making any investment or trading decision.