
- Whale transactions above $1 million jumped 280%, while XRP remains below descending resistance and near the $1 support zone today.
- XRP’s daily structure remains bearish, with RSI near 36 signaling weak momentum and limited evidence of a confirmed reversal today.
- A sustained move above $1.10 could improve momentum, while a break below support would expose the June lows again, closely in focus.
XRP price outlook remains cautious as whale activity rises sharply, while the daily structure stays below resistance and momentum remains weak near key support for traders and market participants.
Whale Activity Surges Across the XRP Ledger
In a recent post, Ali Charts reported a sharp return of XRP whale activity. The post said transactions above $1 million surged 280% within 24 hours. More than 38 large transactions were recorded during the latest period.
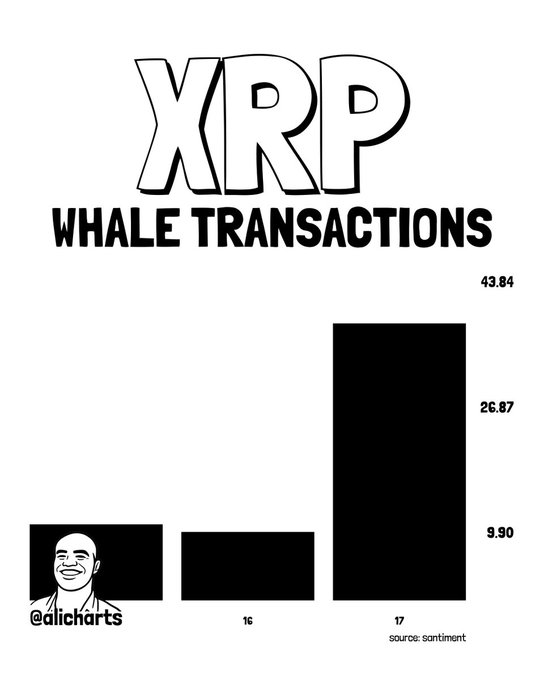
The accompanying Santiment chart shows a dramatic rise in large transactions. Earlier readings remained considerably lower across the displayed timeframe. The latest bar rises sharply, separating it from previous daily activity.
The metric tracks transactions exceeding $1 million rather than total transferred value. Therefore, the increase confirms greater large-transaction frequency across the ledger. It does not confirm whether whales were buying, selling, or repositioning holdings.
Large holders can transfer XRP between exchanges, wallets, and custody addresses. They can also move assets before entering or exiting positions. Consequently, transaction direction requires additional on-chain evidence for confirmation.
XRP Tests a Critical Technical Zone
The daily chart shows XRP trading beneath a descending resistance structure. The latest price stands near $0.9959, keeping the token around $1. That psychological level has become an important near-term reference for traders.
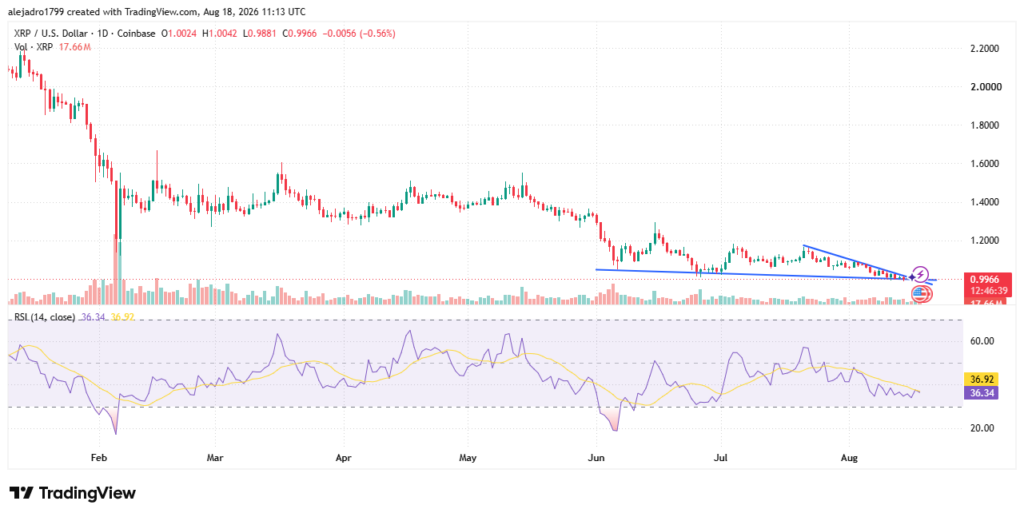
The broader structure remains defined by lower highs and lower lows. XRP recovered from June lows before approaching the $1.20 region. That rebound later failed beneath the descending resistance line from July.

The immediate support area sits close to the current trading zone. A decisive daily close below support would weaken the recent base. Such a move could bring the June lows back into focus.
Resistance currently develops around the $1.05 to $1.10 region. Above that area, the descending trendline remains the larger technical barrier. A daily close beyond that trendline would strengthen the reversal case.
RSI Keeps Momentum Under Pressure
The Relative Strength Index currently sits around 36.19 on the daily chart. Its moving average remains slightly higher, near 36.91. Both readings remain below the neutral 50 threshold for momentum.
The RSI reading shows sellers retain greater short-term momentum. However, the indicator has not entered deeply oversold territory below 30. That leaves room for further weakness before reaching extreme conditions.
The whale surge therefore arrives during a fragile technical structure. Large transactions could precede accumulation, distribution, or increased market volatility. The transaction count alone cannot determine which outcome is developing.
The next price reaction should provide stronger confirmation of market direction. Holding support and reclaiming $1.10 would improve the daily structure. Breaking support while RSI weakens would instead reinforce the prevailing bearish trend.