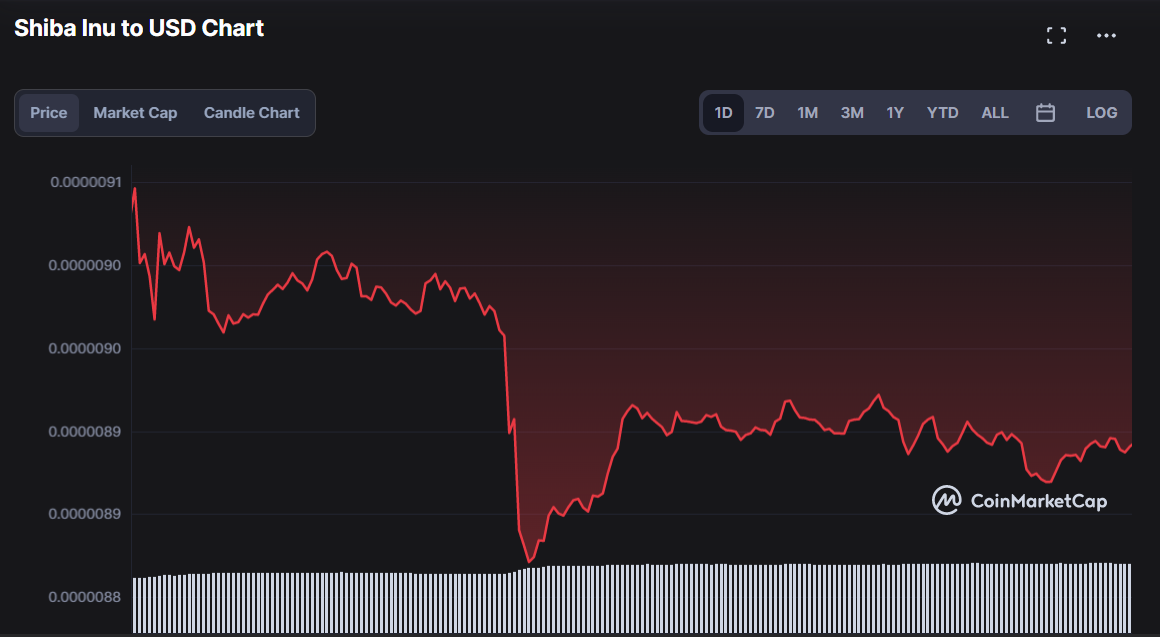
- In the last 24-hours, SHIB price has been following a descending trend.
- Shiba Inu is trading at $0.000008865.
- Bearish sentiment may persist SHIB market as indicated by technical indicators.
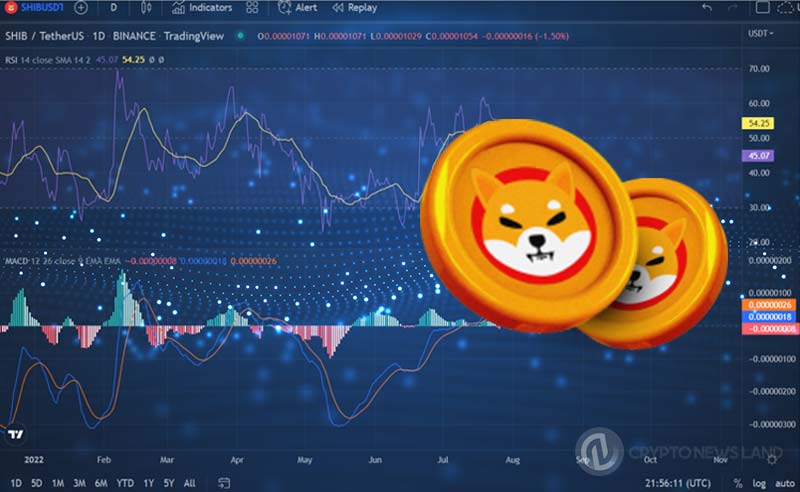
The price of Shiba Inu has observed to follow a descending resistance line. Since the 14th of August, it has been functioning as intended. At the end of October, the price of SHIB made several unsuccessful attempts at breaking out of its trading range. This was followed by the creation of a lower high and a sharp decline.
The current price of Shiba Inu is $0.000008879, which is a decrease of 3.42% from its previous value. This indicates that the SHIB market is in the hands of the bears, as they are driving prices to lows, which has led to the SHIB finding support and resistance levels at $0.000008808 and $0.000009211, respectively. The bearish movement is also evidenced by a decrease in market capitalization, which has decreased by 3.55% as a result of the movement.
The Moving Average Convergence Divergence (MACD) line is currently located below the signal line, which indicates that a bearish sentiment may continue to be experienced in the market in the coming hours. As a result, investors and traders should exercise extreme caution before entering the SHIB market. Additionally, the formation of the trajectory histogram in the negative region indicates that this bearish strength may continue to be felt in SHIB market in the coming hours.
The market is experiencing selling pressure, and the RSI line’s current level of 38.84 indicates that bears are in control. The recent drop below its SMA line is adding to the negative trend that has been observed, which is causing investors to be concerned about the prospect of a bearish persistence.
A bearish sentiment currently prevails in the Shiba Inu market, as indicated by the narrowing of the Bollinger Band (BB) indicator. The lower band gets as low as 0.0000087, while the upper band gets as high as 0.00000927. In the short term, these levels serve as an immediate level of resistance and support for the Shiba Inu price.

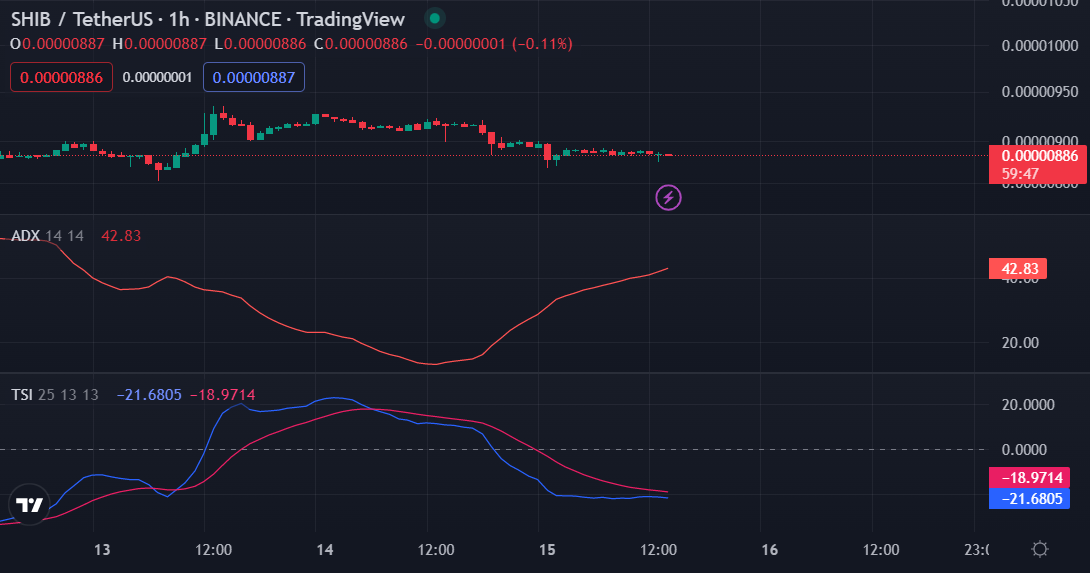
On the 1-hour price chart, the True Strength Index (TSI) is located below the signal line with a reading of -22.2511, which indicates that the bearish sentiment is growing stronger and that this bearish movement might be experienced in the market in the near future.
The ADX line is sloping upwards, which provides investors with a bullish outlook on the market and indicates that bullish sentiment may be observed in the hours ahead if it continues in this direction. Despite the fact that ADX issues a warning to investors at the same time, there is a possibility that SHIB will undergo a price reversal in the coming hours because it has reached the overbought region.
According to the current SHIB price analysis, a downward trend is present in the Shiba Inu price. According to the technical indicators, this behavior could be expected to persist in the upcoming hours.
Read Also:
disclaimer read moreCrypto News Land, also abbreviated as "CNL", is an independent media entity - we are not affiliated with any company in the blockchain and cryptocurrency industry. We aim to provide fresh and relevant content that will help build up the crypto space since we believe in its potential to impact the world for the better. All of our news sources are credible and accurate as we know it, although we do not make any warranty as to the validity of their statements as well as their motive behind it. While we make sure to double-check the veracity of information from our sources, we do not make any assurances as to the timeliness and completeness of any information in our website as provided by our sources. Moreover, we disclaim any information on our website as investment or financial advice. We encourage all visitors to do your own research and consult with an expert in the relevant subject before making any investment or trading decision.