
Avalanche(AVAX)
The price distribution of AVAX/USDT has declined from the July highs of around $33.21 to about $22.48 at the time of writing. The Relative Strength Index (RSI) stands at 44.55, suggesting that AVAX remains within the lower bound, neither overbought nor oversold, and could be highly bullish.
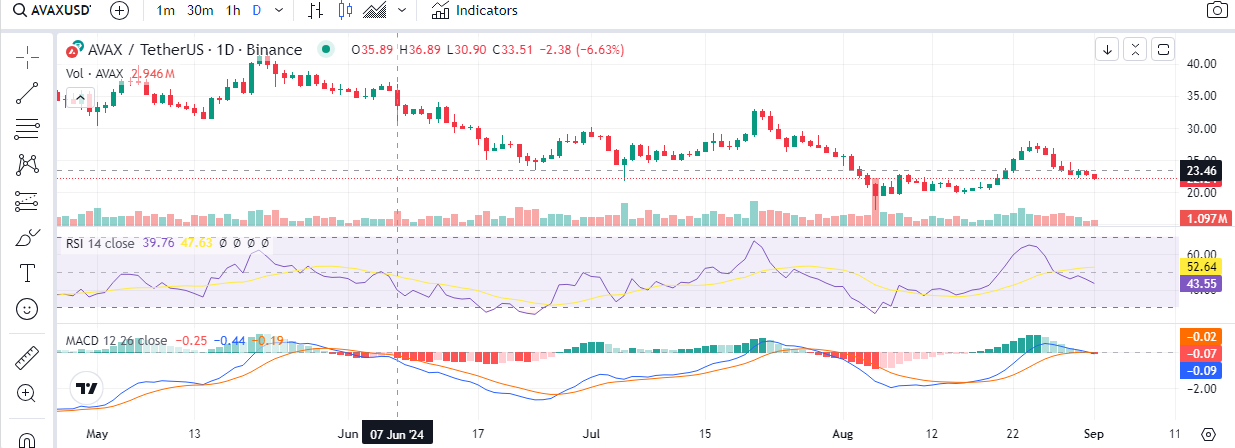
Source:(Tradingview)AVAX/USDT 24-Hour price chart
The MACD indicator confirms that it is still bearish in its crossover as the successive MACD line moves downwards, cutting across the signal line and emphasizing downward pressure. Overall, volume has remained more or less constant, although it declines a bit, which points to lesser activity once the price starts to fall.
The price action of AVAX has been flat as the market fails to provide buying support. The recent drop now focuses on the range of Lows experienced in May through June. Prices are expected to remain on a downward trend in the middle. MACD and RSI indicators confirm this bad market trend, although the relative strength index is right at the brink of the zone where people would be considered oversold, and buyers may eye that price enough.
Polygon(MATIC)
The MATIC/USDT has formed lower highs and lower lows in the recent price action. The MATIC price averaged around $0.70 at the beginning of the year but fell to $0.40, showing a strong bearish market. The more recent candlesticks also indicate further selling efforts as the price closes down mainly at the close of most trading days. The trading activity slowed a little, but the volume performance during the active phase of the price is relatively buzzing; this means the downtrend is well supported by trading
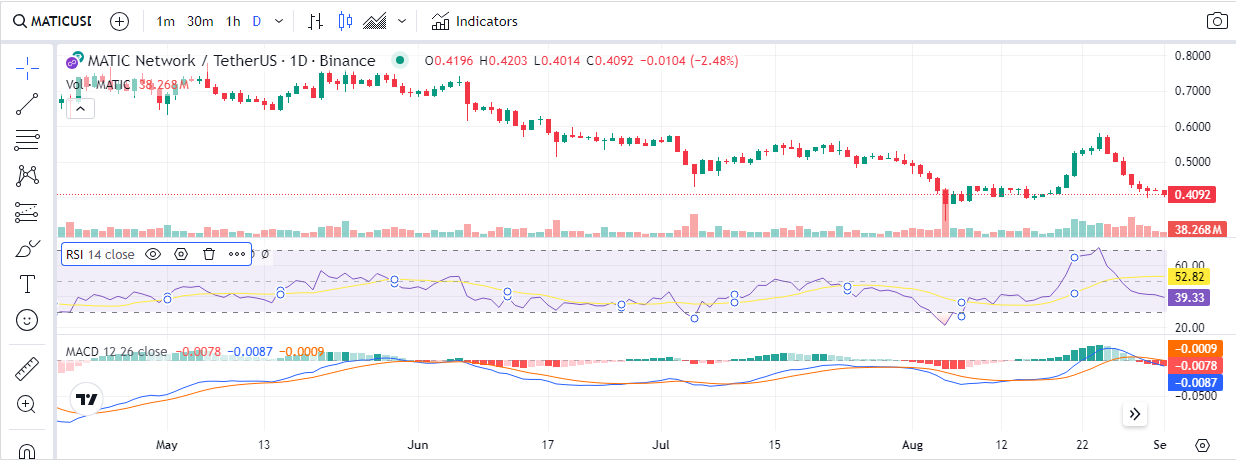
Source:(Tradingview)MATIC/USDT 24-Hour price chart
The indicators further support the expectation for a downtrend. The current value of the RSI is 39.16, which is fairly distant from the neutral level of 50. This implies that the asset is already in the range approaching “oversold.” It means that the bear trend may last until buyers support the market. On the other hand, the MACD shows that the MACD line is lower than the signal line, and both are negative, which encourages the bear movement to progress.
