
Key Insights
- Avalanche price climbed above the 50-day EMA as traders increased futures positions, signaling growing confidence in AVAX’s short-term recovery momentum.
- Derivatives data shows open interest rising to about $480 million while short liquidations significantly exceeded long liquidations, reinforcing bullish sentiment.
- Technical indicators including RSI and MACD show strengthening upward pressure as Avalanche attempts to extend gains after breaking a descending resistance trendline.
Avalanche continued its upward move on Monday as the token traded above the $10 level, extending last week’s rally. The digital asset recorded roughly 13% gains during the previous week, reflecting a broader recovery across the cryptocurrency market.
Besides the market rebound, traders increased activity in Avalanche futures contracts, signaling renewed appetite for risk. Consequently, the latest price movement indicates that participants are positioning for additional upside in the short term.
Futures Data Signals Renewed Trader Participation
Derivatives market activity shows stronger participation among traders during the latest rally. Data from CoinGlass indicates that Avalanche open interest increased about 10% within the past twenty-four hours, reaching approximately $480 million.
Moreover, the open interest weighted funding rate stood at 0.0074%. This level suggests that traders currently pay a premium to maintain long positions, which often reflects positive sentiment in the derivatives market.
Liquidations Highlight Pressure on Bearish Traders
Liquidation data also supports the improving sentiment surrounding Avalanche. Short liquidations reached roughly $745,980 during the same twenty-four-hour period, while long liquidations totaled about $66,500.
Consequently, the higher volume of short liquidations indicates that bearish traders closed positions as prices moved higher. This dynamic often appears when markets move against short positions during an upward trend.

Breakout Above Trendline Adds Technical Support
Avalanche price action also shows a technical shift after the token moved above a descending resistance trendline that previously limited recovery attempts. Additionally, the token now trades near the 50-day exponential moving average around $9.96, a level closely watched by market participants.
The price also remains above the SuperTrend indicator, which strengthens the current bullish bias. However, the 100-day and 200-day moving averages still sit above the current price, indicating that the broader trend remains under pressure despite the recent rebound.
Momentum Indicators Point to Strengthening Buying Pressure
Momentum indicators currently support the ongoing recovery. The relative strength index stands near 65, approaching the overbought region and signaling stronger buying activity.
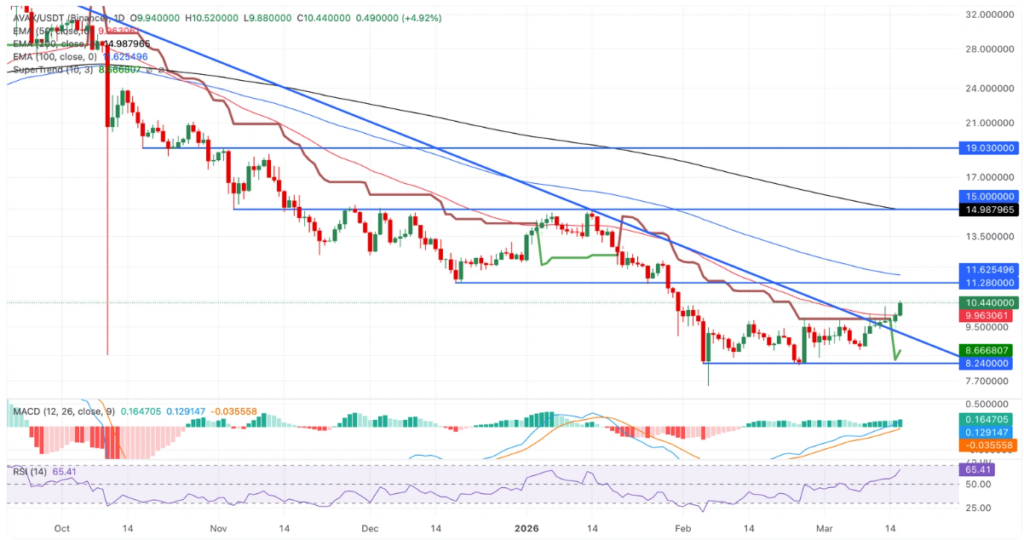
Additionally, the moving average convergence divergence indicator shows the MACD line above its signal line with expanding green histogram bars. This structure reflects increasing upward momentum as traders continue to accumulate positions.
Technical levels now frame the next stage of the price move. If Avalanche secures a daily close above the 50-day EMA near $9.96, the price could advance toward resistance around $11.28, which aligns with a previous market low from December.
Moreover, the 100-day moving average near $11.62 forms another resistance barrier. However, failure to hold above the current breakout zone may shift attention toward support near $9.50, followed by the stronger support floor around $8.24.
