- XRP price outlook centers on $1.40, with sustained support needed before buyers can challenge the $1.53 resistance zone.
- XRP bounced back from $1.00 and the overall bullish momentum is being reduced by rejection near $1.70.
- RSI remains above 50 while MACD stays positive, although declining volume points toward consolidation after the breakout.
Despite this sharp bounce, the price of XRP continues to appear balanced, with $1.40 separating further upward movement from renewed selling pressure.
$1.40 Sets the Immediate Direction
CRYPTOWZRD noted that XRP closed indecisively and called for healthier candles. The trader identified $1.40 as the key level. Holding above that area keeps $1.53 in focus.
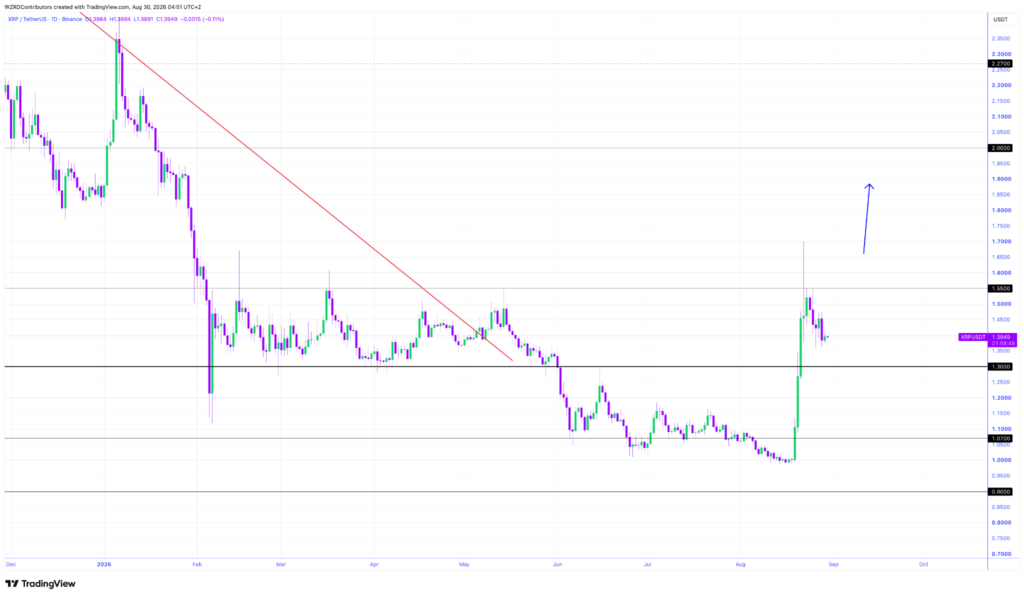
XRP is trading around $1.39 on the displayed daily chart. The latest candle reflects hesitation after the recent recovery. Price has therefore returned toward a closely watched support area.
The earlier decline pushed XRP below $1.00 before buyers stepped in. That reversal produced a strong upward move across several sessions. Consequently, the market structure changed considerably within a short period.
However, the recovery has not yet produced sustained acceptance above $1.50. Price reached approximately $1.70 before sellers reversed the advance. The rejection created a period of consolidation below the recent peak.
Breakout Faces Resistance Above $1.50
The chart shows XRP previously moving within a broadening formation. Its lower boundary gradually approached the $1.00 region. Buyers eventually broke that pattern with a sharp upward expansion.
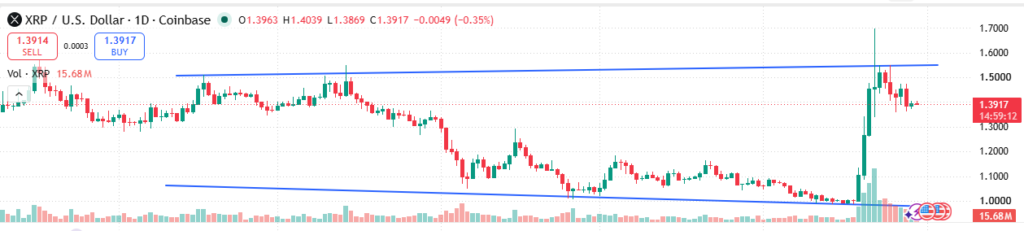
Trading activity also increased considerably during the breakout. The move carried XRP through several resistance areas in quick succession. However, the strongest buying phase was followed by visible profit-taking.

The $1.50-$1.55 zone now represents the main overhead resistance. This region previously marked the upper boundary of the broader structure.Any recovery that breaks above it would make the breakout pattern stronger.
Meanwhile, $1.30-$1.40 would be the key support zone. If this further push were allowed to stand, it would secure the recent gain. A sustained move below that zone would weaken the current recovery.
Indicators Show Momentum Losing Some Strength
The daily RSI currently stands near 64.66, remaining above the neutral 50 level. However, RSI has declined from its recent reading above 80. This shows momentum has cooled following the rapid price increase.
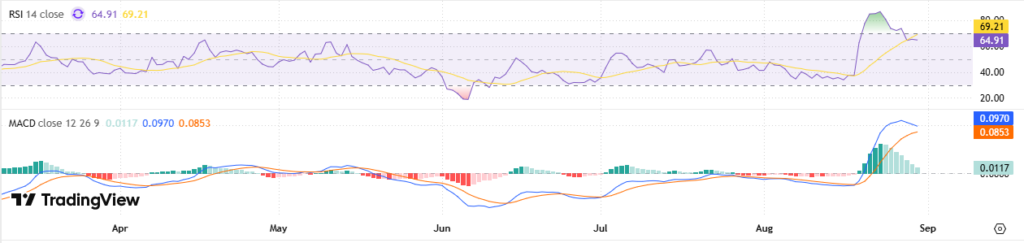
The indicator remains positioned within a relatively firm range. Therefore, the current RSI reading does not confirm a broader bearish reversal. A move below 50 would provide stronger evidence of weakening momentum.
The MACD remains positive, with its main line above its signal line. However, the histogram has contracted after expanding during the breakout. This indicates that upward momentum remains present but has moderated.
Volume has followed a similar pattern after the major price expansion. Activity surged during the initial rally before declining during consolidation. For now, the market needs stronger candles around $1.40 before confirming another directional move.