- XRP’s price is consolidating within a triangle pattern, suggesting a potential breakout by 2025.
- Short-term chart shows significant XRP price volatility, with recent sharp declines highlighting market unpredictability.
- Analyst Armando Pantoja cites regulatory clarity and institutional interest as key drivers for XRP’s predicted price rise.
Crypto analyst Armando Pantoja has forecasted a big rise in XRP’s price, suggesting it could reach $3.84, then $12.75, and eventually $20.30. This prediction comes as XRP continues to consolidate within a long-term triangle pattern on the price charts.

Long-Term Price Chart Analysis
A detailed chart of XRP against the US Dollar on the Kraken exchange highlights key historical and projected trends from 2017 to 2025. The current price of XRP is $0.58285, showing a slight increase of 0.61%. The chart reveals a t price spike in late 2017 and early 2018, followed by a period of volatility and an overall downtrend.
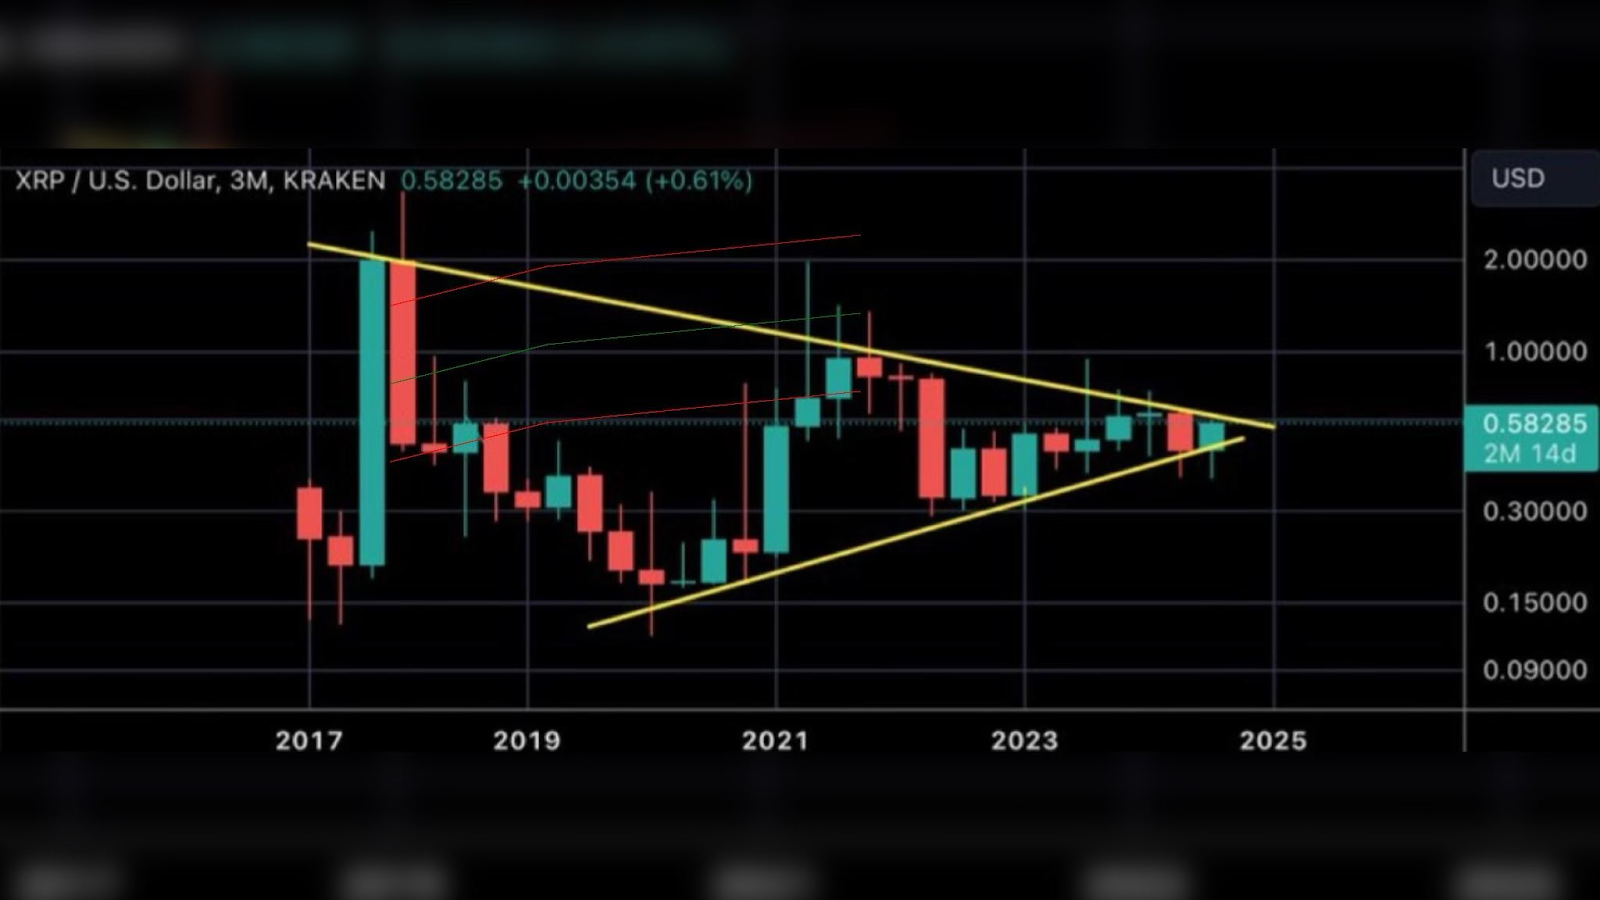
Source; Armando Pantoja on X
The descending resistance line originates from the peak in 2018, while the ascending support line starts from the low in 2020. This triangle pattern indicates a consolidation phase, often a precursor to a major price movement.
The chart’s candlestick representation, with green indicating price increases and red showing decreases, provides a visual understanding of the market’s phases. Each candlestick represents three months of price action, and the triangle pattern extends into 2025, suggesting an impending breakout or breakdown.
Short-Term Price Movements
A shorter-term chart shows XRP’s price fluctuations over the last 24-48 hours. This chart highlights significant volatility, with several peaks and troughs. The price ranged between $0.59 and $0.63, with a notable downward trend towards the end of the chart. A sharp price drop to around $0.59 is particularly striking, indicating a big decrease.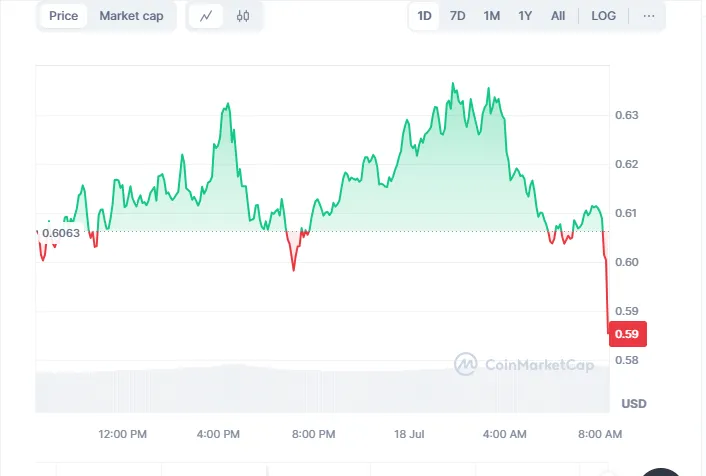
Source; CoinMarketCap
This short-term chart’s time scale covers a 24-hour period and emphasizes the high volatility often seen in crypto markets.
Market Outlook
The convergence of these two charts suggests that XRP has been in a consolidation phase since its peak in 2018. As the price approaches the apex of the triangle pattern, traders are watching for a potential breakout. Armando Pantoja’s prediction of significant price jumps reflects a belief in the strength of regulatory clarity and growing institutional interest in XRP.
These observations highlight the importance of monitoring both long-term trends and short-term price movements in the crypto market. With the potential for substantial price increases, understanding these patterns can help investors make informed decisions.