
- XRP’s symmetrical triangle breakout signals a shift in its price action.
- Resistance at $1.50 and $3.80 could influence the upward movement.
- Indicators suggest momentum building, with RSI at 46.50 and MACD bullish.
XRP has breached a symmetrical triangle build on the monthly chart, indicating a strong price movement ahead. This breakout pattern, often associated with increased volatility, has drawn attention to the asset’s next potential levels.
Technical Breakout Signals Strong Price Movement
The symmetrical triangle breakout on XRP’s monthly chart marks a change in its price structure. This pattern, typically formed by joining trendlines, signals a period of consolidation before a decisive move. XRP’s breakout from this formation suggests an end to prolonged indecision, allowing traction to build.
According to Ali Charts, XRP price fluctuated within this pattern, with multiple peaks and troughs until early 2024. The breakout above the upper resistance occurred with a sharp upward movement, pushing the price above $2.20. The breakout area aligns with a major increase in volatility.
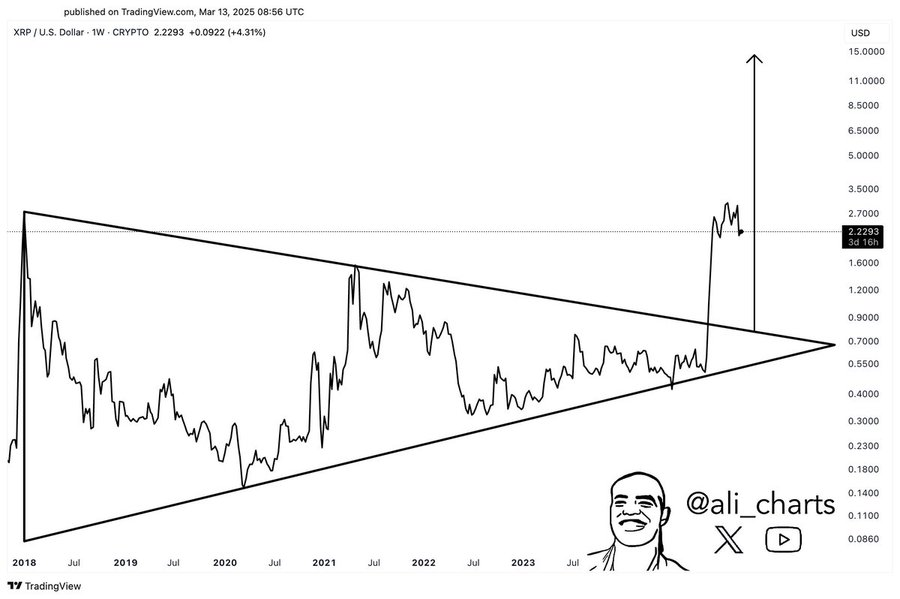
A clean break from the symmetrical triangle often results in extended price action, with technical projections pointing toward a potential move to $15. However, key resistance levels along the way will likely determine the speed and strength of this movement.
Market Performance and Price Levels to Watch
Following this breakout, XRP’s price action will be closely monitored at multiple resistance points. The immediate area of interest lies around $1.50, where previous price reactions have occurred. Beyond this level, further resistance is expected near $3.80, aligning with past market peaks.
If XRP maintains its upward trajectory, additional levels of interest include the $10 zone, which aligns with historical Fibonacci extensions. The final target of $15 reflects a measured move based on the breakout’s range, making it a key level to watch if bullish momentum persists.
According to technical indicators, the MACD shows a slight bullish crossover, with the MACD line at 0.0118 and the signal line at -0.0651, indicating potential upward momentum. However, the histogram remains weak, suggesting indecisiveness.

On the other hand, the RSI is at 46.50, below the central line, thus showing that bears remain in control of the price action. Should RSI go above 50, it is possible that the bullish trend will be reinforced.
Possible consolidation for the price is near $2.30, upward momentum near $2.50, and down support at $2.00. A movement above $2.50 will likely open up more upward momentum, while a breakdown might force the pair back lower to test lower levels.