- XRP’s price is testing critical support levels and may see a major move soon.
- Market indicators show potential for both bullish and bearish trends in XRP.
- Investors are watching key resistance levels that could hint XRP’s next major move.
XRP, the crypto associated with ripple, has seen an increase of 0.64% over the past 24 hours. The coin is currently trading at $0.6022, having a market capitalisation of $33.83 billion, which also marks a 0.76% increase, placing it in the 7th position among the cryptocurrencies by market cap.
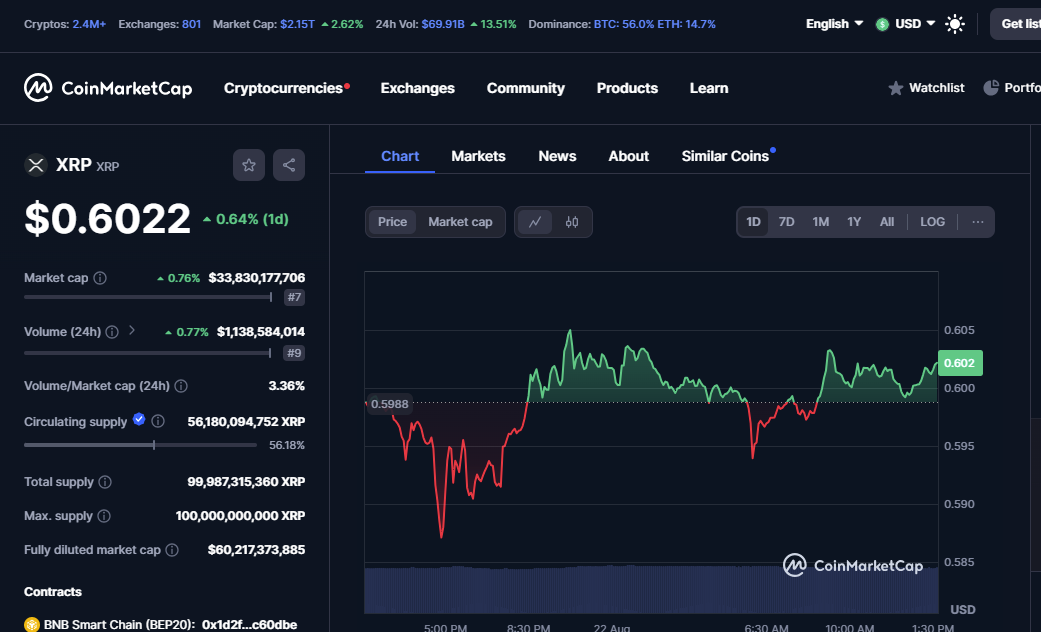
source : coinmarketcap
Currently, Ripple has a circulating supply of 56.18 billion coins constituting approximately 56.18% of its total supply of 99.99 billion XRP. The token witnessed some price fluctuations, as seen in the charts, as prices began trading at $0.5988 but later experienced some volatility, which led to a dip, resulting in a recovery of its current value. The volume-to-marketcap ratio is 3.36%, indicating moderate trading activity, mainly due to its market size . The chart shows that while XRP faced some negative movement, it quickly rebounded, reflecting investor confidence
XRP Price Action
The XRP market is currently decreasing with a minor downward pressure, with its current price at $0.59963 reflecting a slight decrease of 0.11%. The price action has been relatively stable in recent terms, but key technical indicators and chart patterns suggest potential upcoming movements.
The chart shows a clear Fibonacci retracement pattern, highlighting critical levels of potential support and resistance. XRP has retraced to the 38.2% level, a common area for price reversals, with the support level being at $0.38249, which remains a vital point. Moreover, the 26.6% retracement level at $0.5500 acts as a near term resistance. A drop below these levels could signal a move towards the 50% retracement, where further support might be found.
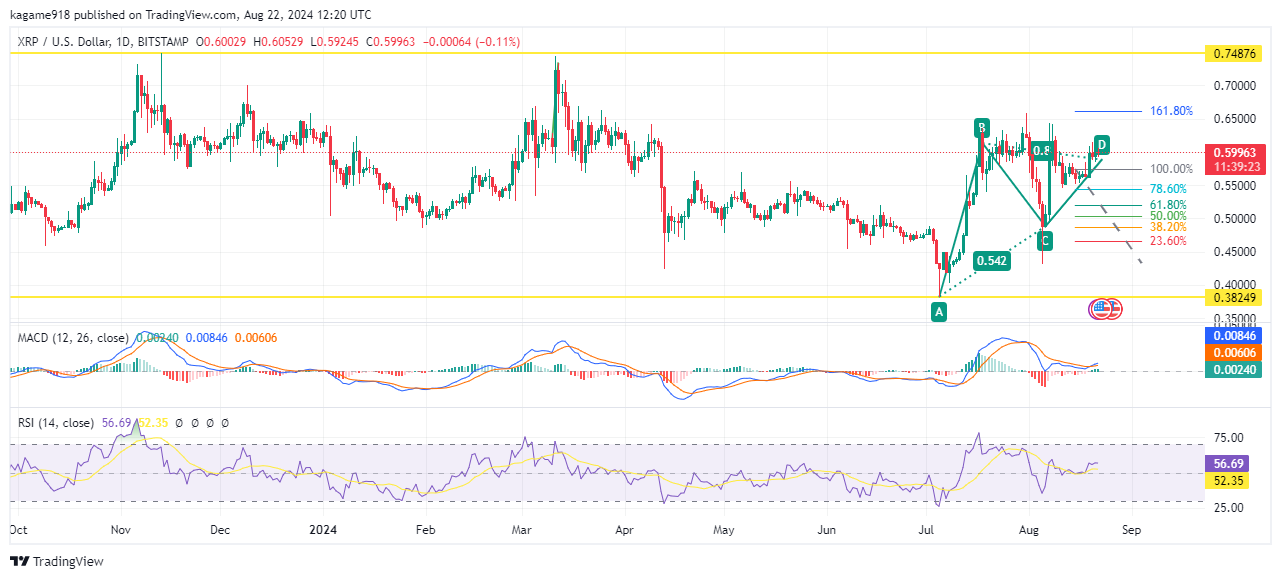
source : tradingview
The Moving Average Convergence Divergence signal is showing a slight bearish divergence with its line crossing below the signal line, which often suggests a possibilities decline in price. The RSI stands at 52.35, which indicates a neutral market sentiment that is neither overbought nor oversold. However, it is approaching the 56.69 level, where a shift towards bullish momentum could occur if it continues to rise.
The price movement has formed a potential ABCD pattern, with the current price at point D, suggesting that XRP might be poised for a reversal or continuation depending on the market conditions. If the price breaks above the recent highs near $0.65, it could potentially reach the 161.80% extension level, making a major bullish move. Consequently, if the price fails to hold at the current support level, it might retest the lows near $0.50, which is followed by a further decline towards the 61.8% retracement level.
