
Key Insights:
- XRP fell over 8% from its weekly high as macro pressures and geopolitical tensions weakened risk sentiment across the broader cryptocurrency market.
- Network growth remained strong, with wallet addresses hitting 7.7 million and daily active users reaching a five-week high despite price volatility.
- Technical indicators and whale accumulation suggest a possible rebound, though key resistance and support levels will determine XRP’s next directional move.
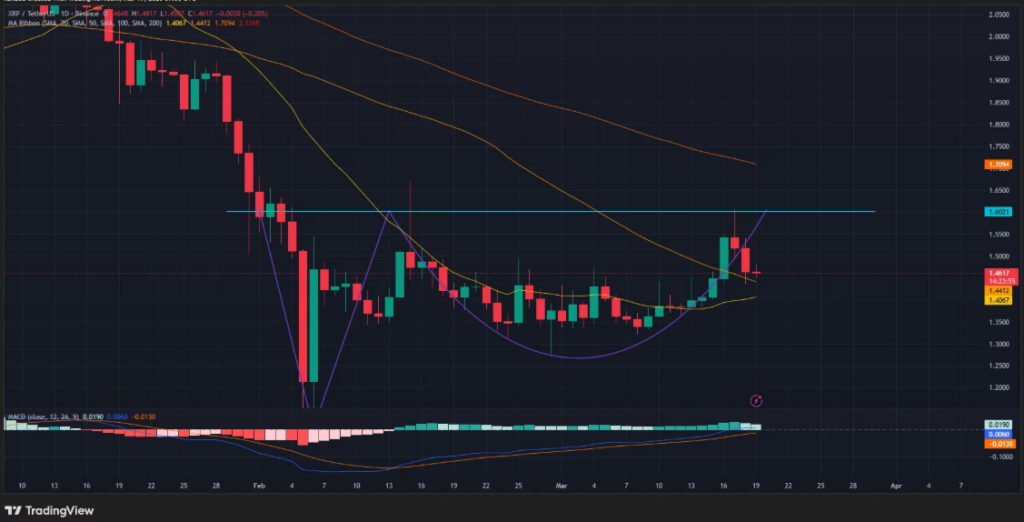
XRP price dropped sharply to $1.46 after reaching a multi-week high of $1.60 earlier this week. The decline followed a wider sell-off across crypto markets as investors reacted to rising geopolitical and macroeconomic risks. Besides the immediate drop, the token has now lost over 8% from its recent peak.
Bitcoin slipping below the $70,000 level added pressure across altcoins and weakened overall market confidence. Hence, traders turned cautious as fears of a deeper correction toward $60,000 gained traction. Rising oil prices, triggered by tensions in the Middle East, further reduced appetite for risk assets.
Fed Signals Add to Uncertainty
The macro backdrop also shifted after Federal Reserve Chair Jerome Powell signaled a cautious stance on interest rate cuts. Consequently, markets adjusted expectations as inflation remained persistent and policy direction stayed data-driven. This shift reduced liquidity expectations and added pressure on crypto prices, including XRP.
Despite the price decline, on-chain data highlighted strong network expansion and user engagement. Significantly, XRP wallet addresses reached a record 7.7 million, reflecting steady adoption even during volatility. Daily active addresses also climbed to a five-week high, indicating consistent participation across the network.
Whale Activity Suggests Accumulation
Large holders have started accumulating XRP after a prolonged period of distribution. Moreover, such behavior often signals confidence among experienced investors and can precede broader recovery phases. Retail traders typically follow these movements, which may support future price stability.
On the daily chart, XRP has formed an Adam and Eve pattern, which traders often view as a bullish reversal signal. However, the price recently pulled back after testing the neckline near $1.60. A confirmed breakout above this level could trigger renewed upward momentum.
Indicators Point to Building Momentum
The 20-day moving average is approaching a bullish crossover with the 50-day average. Additionally, the MACD indicator shows upward movement, suggesting that buying pressure is gradually increasing. These signals indicate that momentum may be shifting despite the recent decline.
Traders are closely watching the $1.50 resistance level, which remains a critical short-term barrier. A sustained move above it could push XRP toward $1.60 and potentially $1.70. However, a drop below $1.44 would weaken the current setup and challenge the bullish outlook.
