- The market volatility will exhibit a quick price shift before it bursts through a potential price barrier.
- The price of XRP needs to break through the resistance level of $2.50 specifically and the support level at $2.42 to avoid a potential price decline to $2.20.
- Market confirmation of an upward trend requires a price rise breaking through $141.81B yet a fall past $141.17B could trigger additional market decline.
XRP, is exhibiting a notable technical pattern known as a Bollinger Bands squeeze, suggesting a potential significant price movement. The 12-hour XRP chart shows a Bollinger Bands squeeze according to analyst observations which could indicate an upcoming significant price change.
As of today, XRP is trading at around $2.43, up 0.78% in the last 24 hours. Trading volume remains strong at $5.48 billion, which shows that market interest in XRP is still high. Resistance is identified at $2.50, with support levels at $2.42 and $2.38. If it fails to maintain support at $2.20, analysts warn that the price could decline to the $1.50–$1.60 range.
XRP Technical Indicators
Currently market capitalization of XRP is fluctuating around $141.36 billion, with both BUY and SELL signals at this level. The market cap has recently undergone a sharp decline, followed by a mild recovery, suggesting volatility in market sentiment. A decisive move above $141.81B could confirm a bullish trend, while failure to hold $141.17B may lead to further downside pressure.
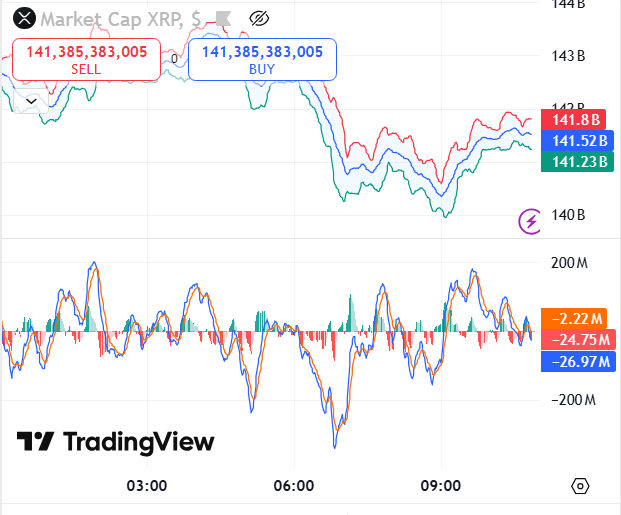
Moreover,the MACD is currently trading at -26.97 below the signal line, indicating negative momentum for XRP. The Upper Bollinger Band is seen at 141.82B, with the middle Band at 141.52 and the lower Band at 141.23. These Bollinger Band squeezes in XRP show signs of significant price surges.
However, there are signs of oscillator contraction, which could indicate an upcoming reversal if buying volume increases. This aligns with the observed minor recovery in the market cap, hinting at potential stabilization.
XRP Technical Levels and Market Implications
The current technical indicators for XRP, particularly the Bollinger Bands squeeze, suggest that the cryptocurrency may be on the verge of a significant price movement.Thus,If market cap moves towards the middle band and surpasses it, XRP could shift into a bullish phase, potentially pushing towards $143B.
