- XRP consolidates within $2.0000–$2.6000, facing resistance at $2.6000; breakout may start bullish momentum.
- Support levels at $1.6400, $1.3700, and $1.2200 signal key safety zones during potential downward price movements.
- Momentum indicators suggest limited strength, with oscillators hinting at oversold conditions and a possible price rebound.
The price movements of XRP show a period of consolidation with important levels of support and resistance. With a symmetrical triangle formation in the 3-day timeframe, the price indicates less volatility and a possible breakout. Now down 5.92% to $2.0531, XRP is having trouble keeping up its upward trend. Key levels that define the upper and bottom limits of this consolidation zone are $2.6000 and $2.0000.
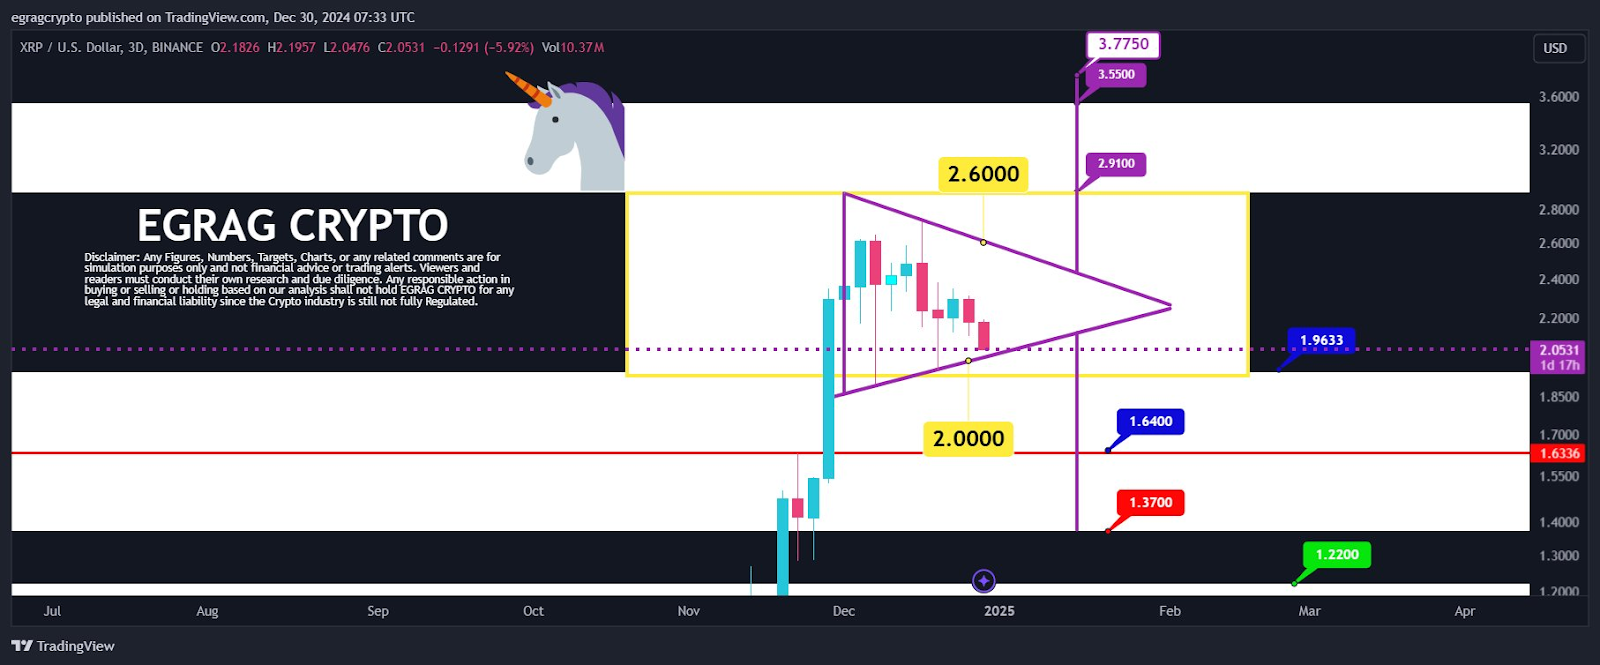
Source: Egrag Crypto
Resistance Levels Define Breakout Potential
The primary resistance levels include $2.6000, $2.9100, $3.5500, and $3.7750. Notably, breaking $2.6000 may trigger upward momentum. Additionally, intermediate levels like $2.65 and $2.75 present short-term barriers for buyers. Above these, $2.9100 could serve as a potential target for bullish movement. Moreover, overcoming these hurdles could lead to fireworks, propelling the price toward higher levels like $3.5500 or $3.7750.
Conversely, support levels are marked at $1.6400, $1.3700, and $1.2200. These areas offer a safety net for potential declines. A confirmed break below $2.0000 could shift the price toward these lower targets, threatening further bearish action.

Indicators Show Limited Momentum
The 4-hour chart highlights a rectangular price range between $2.0000 and $2.8000, reinforcing limited directional movement. Besides, the stochastic RSI oscillates at oversold levels, indicating slowing bearish momentum. With K-line at 7.9930 and D-line at 6.1816, conditions remain ripe for potential rebounds.
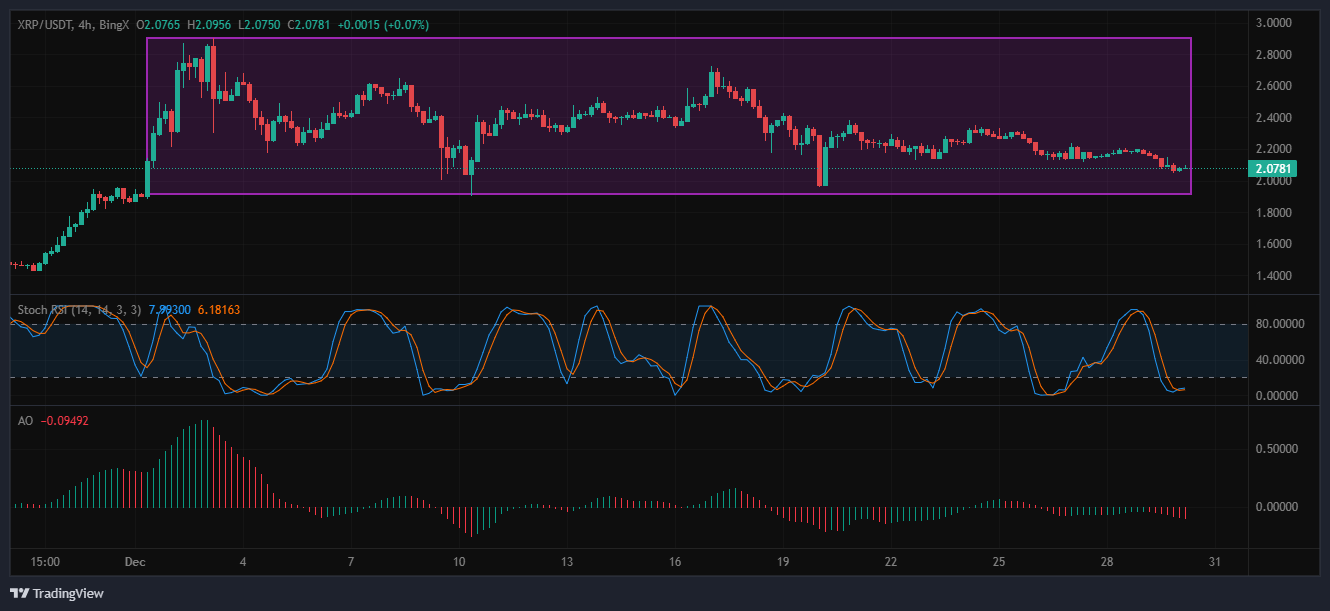
Source: BingX
The Awesome Oscillator shows alternating red and green bars, reflecting weak trend strength and minimal sustained momentum. Its latest reading at -0.09492 suggests continued negative momentum within the range. Candle patterns exhibit alternating bullish and bearish moves, consistent with sideways trading behavior. Moreover, volume levels remain stable, indicating a lack of decisive breakout attempts.
