- Whale wallet “0xa92” swaps $26.5M in $STETH for $AAVE, with unrealized gains of $18M (+42%).
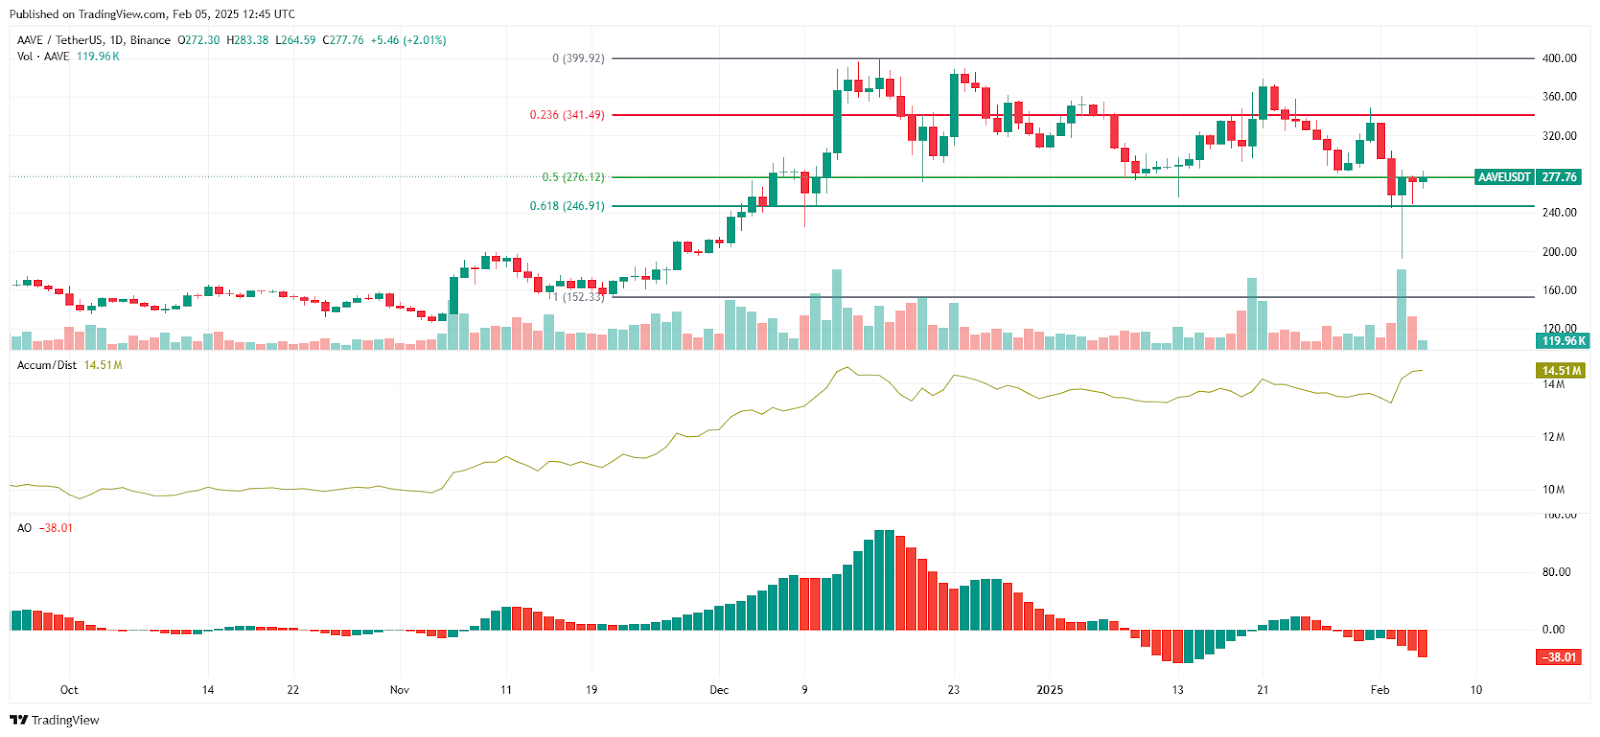
- AAVE price remains in retracement; support at $246.91 and resistance at $341.49 could shape upcoming moves.
- The A/D line shows capital inflows, suggesting accumulation despite bearish signals from the Awesome Oscillator.
In a recent move, a whale multi-sign wallet, identified as “0xa92,” made a transaction involving $AAVE. Over the last five hours, the wallet swapped 10,090 $STETH (worth $26.5 million) for 102,259 $AAVE. This transaction occurred at an average price of $259.13 per $AAVE. Currently, this wallet holds 230,192 $AAVE, valued at $62.2 million. The unrealized profit stands at over $18 million, marking a +42% gain.
AAVE Price Movement and Fibonacci Analysis
The $AAVE/USDT trading has shown notable price movements in recent days. The price opened at $272.30, reaching a high of $283.38, and closed at $277.76, gaining 2.01%. Fibonacci retracement levels highlight key support and resistance zones.
Resistance is located at $341.49 (23.6%) and $399.92 (0%), while support is located at $246.91 (61.8%) and $276.12 (50%). The data shows a decline that was followed by a rise close to the 50% Fibonacci level.

Additionally, the trading volume recorded 119.96K, reflecting moderate market participation. The accumulation/distribution (A/D) line stands at 14.51 million, showing an inflow of capital. However, the Awesome Oscillator (AO) records -38.01, indicating bearish momentum.
Source: CryptoRank
Market Sentiment and Technical Outlook
Despite recent fluctuations, the price bounced from the $246.91 level, staying above the 50% Fibonacci retracement zone. The resistance zone at $341.49 remains unbroken, showing a lack of decisive bullish strength. The AO histogram displays a declining trend, with red bars signaling a weakening bullish move. This suggests that the market sentiment is shifting towards consolidation.
Moreover, the A/D line suggests accumulation, with capital inflows supporting the price recovery. Volume spikes indicate increased market interest at lower price levels, contributing to the bounce from support. The market remains in a retracement phase, yet Fibonacci levels serve as key potential reversal points.
