- SUI has gained 6.50% weekly, while its 290-day falling wedge keeps price near a repeatedly tested lower trendline.
- SUI trading activity remains elevated, with $486.64 million in volume and renewed liquidation spikes during August price movements.
- A confirmed wedge breakout could target $2.00-$2.20, while a lower trendline break would invalidate the reversal structure.
SUI remains near a key technical decision area, with a long falling wedge converging after months of lower highs, lower lows, and repeated support tests.
A 290-Day Falling Wedge Shapes Price Action
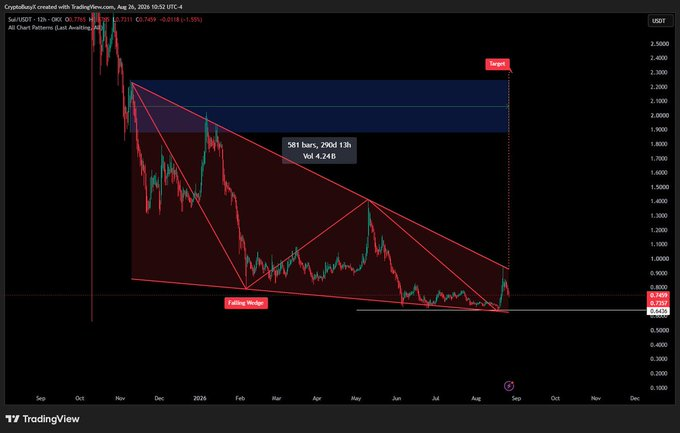
CryptoBusy described SUI as a chart worth watching at this stage. TradingView’s pattern recognition has identified a falling wedge lasting roughly 290 days. The formation spans nearly the entire decline from the earlier highs.
Source: X
Price has repeatedly created lower highs and lower lows during this period. However, both trendlines have gradually converged as the decline progressed. That compression has brought price closer to the wedge’s narrowing endpoint.
The upper trendline has repeatedly capped recovery attempts throughout the formation. One notable rebound reached approximately $1.40 before sellers returned. That rejection produced another lower high within the broader structure.
The lower trendline has generated several reactions during the prolonged decline. Price has repeatedly approached this boundary before producing temporary recoveries. The latest movement has again placed price near that important area.
Liquidations Increased During Major Price Movements
The perpetual liquidation chart shows several distinct periods of elevated activity. The largest displayed event occurred around May 8 through May 10. A red bar extended close to the negative $20.05 million level.

Several large green liquidation bars followed between mid-May and early June. Multiple spikes reached above the $10 million mark during that period. SUI also experienced wider price movements during those elevated liquidation sessions.

Liquidation activity became more intermittent as price declined through June.The token then spent much of June and July around $0.60-$0.70. August brought another noticeable increase in liquidation activity.
SUI is as of writing trading at $0.7611 as of the latest market data supplied. It has a 24-hour gain of 0.35% and weekly gain of 6.50%. The 24-hour trading volume reported is close to $486.64 million.
Breakout Or Breakdown Will Define the Structure
The post identifies the upper trendline as the breakout level. A sustained move above that boundary would confirm the wedge breakout. The measured target is positioned around the $2.00-$2.20 range.
The chart’s blue target region extends toward approximately $2.30. That projection comes from the established width of the falling wedge. However, the target remains dependent on confirmed movement above resistance.
A breakdown beneath the lower trendline would invalidate the reversal structure. Such weakness would leave the broader descending pattern technically intact. The next sustained reaction therefore remains central to the setup.
Open interest is led by Gate at approximately $108.35 million. KuCoin follows with $105.69 million, while Bybit records $64.32 million. Binance leads reported volume with approximately $257.06 million.