
- Solana gained 38 percent after retesting the $130 support and now trades near $166 with strong structure.
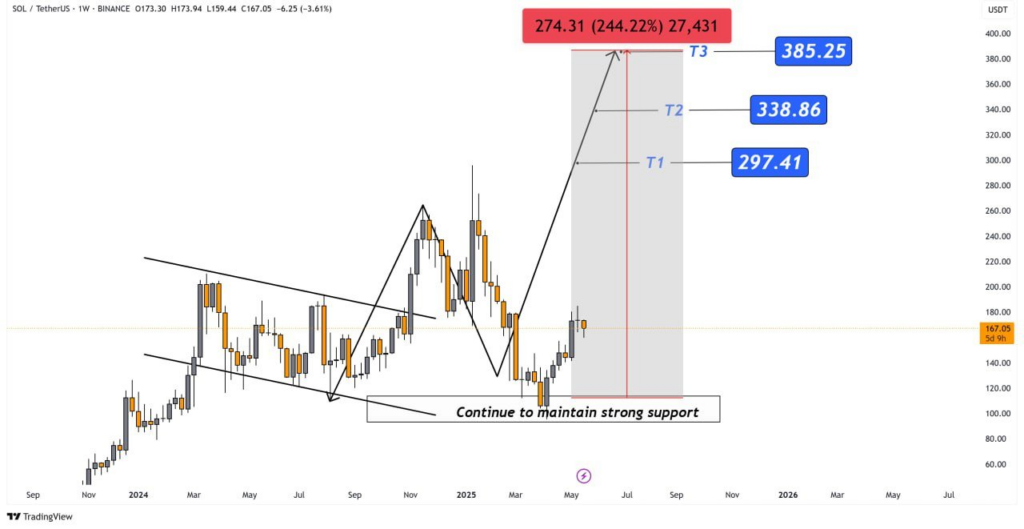
- The chart shows a rising move with clear target zones placed at $297 and $338 and then $385 for upside.
- This structure suggests a new impulse wave that may continue higher if buyers push above $170 in coming weeks.
Solana (SOL) has confirmed a key support retest and is now building momentum toward a potential 244% price increase. According to an analysis published on May 21, 2025, the structure signals a strong continuation wave with targets set at $297.41, $338.86, and $385.25. The current price hovers around $166 after rebounding from the $120–$130 accumulation zone.
Analyst @VipRose_ noted that SOL has successfully maintained its structural support and launched a clean upward trend above the $170 zone. The chart illustrates a breakout pattern following a prolonged consolidation phase, now showing renewed strength in bullish momentum. The projected move from $166 to $385.25 represents a 244.22% upside if the wave follows its forecasted path.
The outlined path suggests that Solana’s price has room to run, supported by consistent buying pressure and market structure confirmation. As price maintains above key technical levels, investors are watching closely for a test of the T1 level near $297 in the coming weeks.
Structure Confirms Strength as SOL Holds Key Support
The chart presents a clean breakout from a descending wedge pattern, followed by a significant support retest. This confirmation of the $120–$130 zone as a demand area has triggered renewed confidence. The bounce and shift above $160 indicate buyers have stepped back in with conviction.
A 38% gain from the ideal entry range already materialized as price now tests the $170 resistance area. The analyst points to this move as the beginning of an impulsive wave. Historical data shows similar behavior in prior uptrends where Solana consolidated before making strong directional advances.

The structure also identifies a zone marked “Continue to maintain strong support,” reinforcing its importance as a foundation for future moves. Price action remains above this zone, and the bullish structure appears intact. If momentum continues, T1 at $297.41 will likely be tested first.
Key Targets Defined: $297, $338, and $385
Three major price targets are clearly defined on the chart: $297.41 (T1), $338.86 (T2), and $385.25 (T3). Each level is derived from the current wave projection and prior resistance zones. These levels reflect technical barriers that traders will monitor for potential reversals or confirmations.
The final target at $385.25 marks a 244% increase from the recent low. This aligns with the overall structure, where the retest of support sets the stage for expansion. The progression through these targets depends on sustained volume and continuation of demand.
Solana’s ability to close above $170 consistently will be critical to validate the current setup. A clean break of the T1 level would confirm strength and likely accelerate toward T2 and T3. Price behavior at each stage may shape market sentiment heading into Q3 2025.
