- SOL has reclaimed a long-term support zone, keeping the chart focused on a possible recovery toward $233.8.
- Binance leads SOL derivatives activity, with nearly $979 million in open interest and $846 million in reported volume.
- A confirmed break above $233.8 could expose $456, while current consolidation keeps the breakout scenario unconfirmed.
Solana market outlook remains centered on reclaimed support, heavy derivatives activity, and a long-term structure pointing toward higher resistance levels.
Reclaimed Support Establishes the Current Structure
The long-term chart shows SOL repeatedly reacting around a major horizontal support zone. That level has influenced several reversals across previous market cycles. Recent price action has returned toward the same area after another broad correction.
JAVONMARKS noted that SOL continues holding after reclaiming this key support. The chart shows price consolidating around the highlighted zone rather than breaking decisively below it. This keeps the recovery structure visible across the longer timeframe.
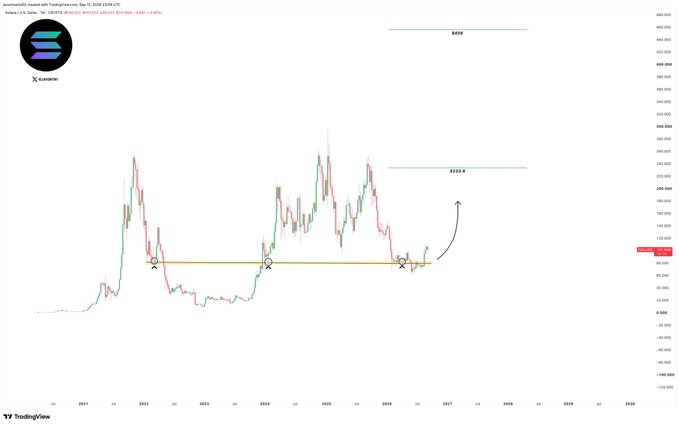
Previous cycles show strong advances following extended periods around this horizontal level. The 2021 rally provides the earliest major example within the chart. Later recoveries during 2023 and 2024 followed similar support-based formations.
The latest structure therefore resembles an established base rather than a confirmed breakout. Price needs continued support retention before the projected upside path gains confirmation. A sustained breakdown would instead challenge the broader technical setup.
Current Trading Shows Tight Price Consolidation
The market data as of writing places SOL at $101.72, following a session marked by several reversals. Price initially moved lower before buyers pushed it toward the $102 region. Sellers later rejected that advance and returned price toward the middle range.
The session high reached approximately $102.25 before momentum weakened. Price subsequently moved lower and briefly approached the $101.25 area. Buyers then regained ground and pushed the market back above $101.60.

The current structure shows repeated resistance around $102.00. Meanwhile, the $101.50 region continues providing nearby support during pullbacks. Price remains compressed between these levels after the earlier volatility.
The broader market data also shows considerable derivatives participation. Binance holds approximately $979.15 million in SOL open interest. Bybit and OKX follow with roughly $730.36 million and $662.79 million.
Derivatives Activity Meets the Long-Term Targets
Binance also leads the reported SOL trading volume with approximately $846.20 million. OKX records about $539.55 million, followed by Gate at $273.42 million. CME contributes roughly $225.61 million, maintaining a notable position.
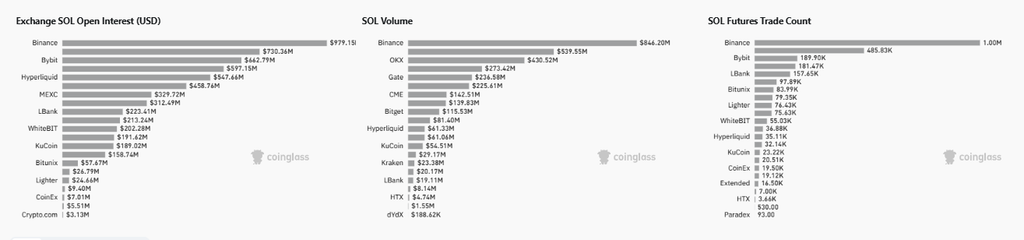
Futures trade counts provide another measure of activity across exchanges. Binance records around 1 million trades, while Bybit reaches approximately 485.83K. Other platforms show progressively smaller counts across the displayed ranking.
The postidentifies $233.8 as the next major technical objective. The chart projects a move exceeding 120% from the highlighted starting region. A sustained break above that resistance would bring $456 into focus.
However, neither projected target has been confirmed by current price action. SOL remains near its reclaimed support while derivatives participation stays elevated. The setup therefore depends on support retention, renewed momentum, and eventual resistance clearance.