
Key Insights
- Solana ETF inflows reached $22.14 million this week, signaling sustained institutional accumulation and reinforcing short-term support above the 50-day EMA level.
- Futures open interest climbed to $5.53 billion, highlighting increased retail participation and growing expectations of near-term price volatility.
- Technical indicators show moderate bullish momentum, but Solana must break above the $98 resistance to confirm a broader recovery trend continuation.
Solana traded below the $90 level on Friday while maintaining support slightly above the 50-day EMA near $87.42. The price showed signs of stability after closing at $89.05 in the previous session. In addition to holding this level, the asset showed early strength as buyers defended short-term support.
However, the broader structure remains capped below higher moving averages. The 100-day EMA near $98 and the 200-day EMA around $117 continue to limit upward expansion. Consequently, price action remains in a recovery phase rather than a confirmed breakout trend.
Institutional Flows Strengthen Market Sentiment
Institutional demand showed renewed momentum as exchange-traded fund inflows extended for the third consecutive day. Data indicates that Solana-focused ETFs recorded $15.50 million in inflows on Thursday alone. Additionally, total weekly inflows climbed to $22.14 million, signaling steady capital return.
Moreover, this accumulation aligns with broader market positioning among larger participants. The consistent inflow pattern suggests growing confidence in Solana’s near-term outlook. Hence, institutional activity continues to provide a foundation for price stability.
Retail traders also increased their presence in the derivatives market, supporting the current price structure. CoinGlass data shows that Solana futures open interest reached $5.53 billion on Friday. This rise followed a period of declining positions, indicating renewed engagement.

Significantly, higher open interest reflects growing expectations for price movement. Traders appear to position for potential upside while leveraging short-term momentum. Additionally, this buildup often adds liquidity, which can amplify price swings in either direction.
Technical Indicators Show Gradual Momentum Build
Technical indicators suggest improving momentum without signaling a strong breakout yet. The MACD remains above its signal line with positive histogram bars, indicating constructive movement. Meanwhile, the RSI stands at 55, showing moderate bullish strength.
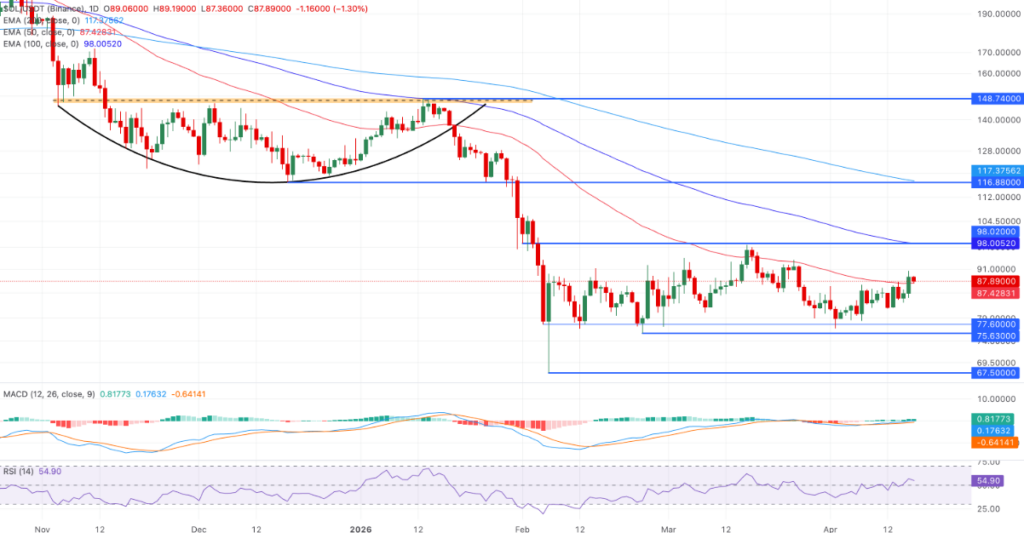
However, Solana must clear the 100-day EMA near $98 to confirm a sustained rally. Beyond that, the 200-day EMA at $117 represents a major structural resistance. Consequently, upward progress depends on breaking these technical barriers.
On the downside, the 50-day EMA at $87 continues to act as immediate support for price stability. A sustained move below this level could weaken the current recovery structure. Moreover, such a breakdown may trigger a decline toward the February low near $77.60.
Therefore, maintaining support remains critical for preserving short-term momentum. Market participants continue to watch this level closely as positioning builds across both spot and derivatives markets.
