
- A large cluster of short positions faces liquidation if SOL reaches $90.6, potentially increasing volatility.
- SOL trades between $83.00 support and $89.58 resistance, keeping price action compressed in the short term.
- SOL posts a 0.8% daily gain and rises 0.7% against BTC, holding steady near key technical levels
Solana traded near a key liquidation threshold as price action approached levels that could trigger significant short position closures. At the time of reporting, SOL was trading at $84.57, reflecting a 0.8% increase over the past 24 hours. The asset was also traded at 0.001269 BTC, which rose 0.7 percent against Bitcoin in the same time frame. Notably, market data shows that if SOL reaches $90.6, a large cluster of short positions faces liquidation pressure.
Price Holds Above $83.00 Support
SOL continues to hover above its defined support at $83.00. This level has contained downside attempts within the current 24-hour range. However, price remains below the stated resistance at $89.58, keeping the market inside a compressed band.
The 24-hour structure shows buyers maintaining marginal control, although momentum remains measured. Meanwhile, the narrow distance between the current price and resistance keeps upside pressure active. As a result, traders monitor reactions near $89.58 closely.
Importantly, the liquidation data introduces an additional layer to this setup. A move beyond resistance would place price within proximity of the $90.6 liquidation cluster. Therefore, volatility could expand if price accelerates toward that threshold.
Liquidation Cluster at $90.6 Draws Attention
Liquidation heatmap data highlights concentrated short exposure near $90.6. This zone represents a point where leveraged short positions could close automatically if price rises further. Consequently, that level stands out within the current structure.
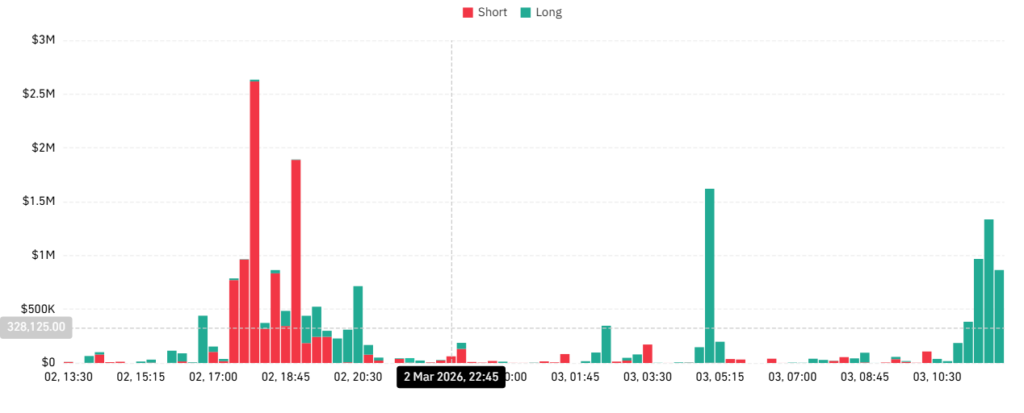
The Coinglass liquidation chart displays significant short liquidations earlier, highlighted by tall red bars clustered on the left. More recently, green bars have increased, indicating rising long liquidations. This shift reflects changing leverage dynamics, with concentrated liquidation spikes suggesting heightened volatility around nearby price levels and key thresholds.
However, SOL must first clear $89.58 resistance to approach that area. Until then, price remains within its established range. The existing gap between $84.57 and $90.6 is approximately 6.03.
Moreover, the short liquidation events are usually accompanied with a rise in volume. Hence, traders follow order movement as the prices improve.
Intraday Structure Within 24H Range
Within the 24-hour window, SOL trades between $83.00 support and $89.58 resistance. The present 0.8% daily gain keeps price closer to the lower boundary than the upper band. Moreover, the BTC couple indicates an increase of 0.7%, which supports the relative power on the day.
Nonetheless, price action does not exceed the ascertained levels. As trading continues, the focus stays on $83.00 for downside protection and $89.58 for breakout confirmation. Above that, the $90.6 liquidation zone remains a clearly identified threshold.
