- Solana has repeated its expansion and accumulation pattern, with $110 marking the key downside level before another potential advance.
- Liquidation activity intensified during major moves, while August produced the clearest short-side liquidation spike across the chart.
- Daily active addresses rose 52% to 4.1 million, keeping network activity firm as price remains above $120 in the latest supplied data.
Solana is consolidating after another sharp expansion, with a possible $110 sweep ahead. Rising network activity and heavy liquidations provide additional context for the evolving structure in the latest cycle.
Expansion Gives Way to Another Accumulation Phase
Solana is entering another key phase after expansion lifted the price toward $140. Sweep says the structure resembles last month’s expansion and accumulation cycle. The latest chart shows consolidation after that advance.
According to Sweep, the current phase remains accumulation rather than confirmed continuation. The commentary allows a possible move below $110 before another advance. That level becomes a central reference within the present structure.
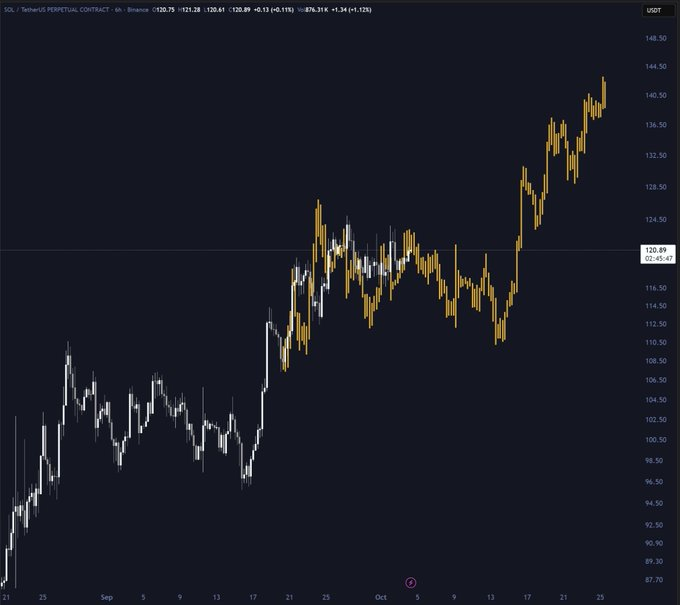
The chart shows expansion from roughly $97 toward the 115–120 region.Price was then able to rally with successive moves in the $114-$121 range. A later decline toward $112 created another lower boundary before recovery.
Sweep’s comparison gains context from the earlier expansion and accumulation sequence. Sui Community separately reported rising activity across several major Layer 1 networks. Both datasets provide separate measures of the current market structure.
Liquidations Track the Market’s Major Moves
The new action was trading price from about $112 into the $130 and into the $140. Several pullbacks appeared, but recoveries established additional local highs. Price reached the 140–143 region before the displayed consolidation.

The liquidation data adds another view of leverage during these market cycles. Large liquidation clusters appeared around major directional movements. Activity became more pronounced as price entered stronger expansion phases.

Late May and early June produced the largest early liquidation activity. Large green bars appeared around June 1 during a sharp adjustment. The associated decline shows leveraged positions facing pressure during that move.
August delivered the clearest liquidation spike across the entire chart. A large red bar appeared around August 18 during a sharp advance. That event marked the strongest short-side liquidation episode shown.
Network Activity Adds Context to the Structure
September continued showing mixed liquidation activity as price climbed higher. Green and red bars appeared around several directional moves. The price line was very close to the $120 area by the end of September.
Leverage is cleared in the liquidation pattern in advances and pullbacks. Neither side maintained complete control across the displayed period. Instead, activity expanded whenever price movements became more forceful.
The network activity data adds another layer to the market picture. Sui Community reported daily active addresses across several major Layer 1 networks. Solana rose from 2.7 million to 4.1 million addresses, gaining 52%.
That increase was smaller by percentage than Aptos and Sui. Yet it remained the largest active-address base among networks gaining activity. The data places the network among stronger growth performers.
The latest supplied price stands at $121.64, with daily volume near $2.41 billion. Price rose 0.53% over 24 hours and 2.02% across seven days. The market therefore remains above the $120 area.