
- SOL remains bearish below $83.98, while a sweep beneath $70.58 could create a conditional rebound setup.
- The major clearing of liquidations occurred in derivatives data, with the sharpest event seen in leverage clearing in late-May.
- A sustained three-day close above $83.98 could target $98.41 and $116.88, while breakdown risks $62.96 and $60.13.
SOL has been on a prolonged downtrend and is still under pressure, traders are awaiting confirmation of the next big directional move at support levels of $70.58 and resistance levels of $83.98.
Bearish Structure Remains Dominant
Finora AI’s three-day market read keeps the broader bias bearish unless $83.98 is reclaimed. The token as of the time of writing, trades around $75.19, with 24-hour volume near $569.53 million. That positioning leaves price between important support and resistance levels.
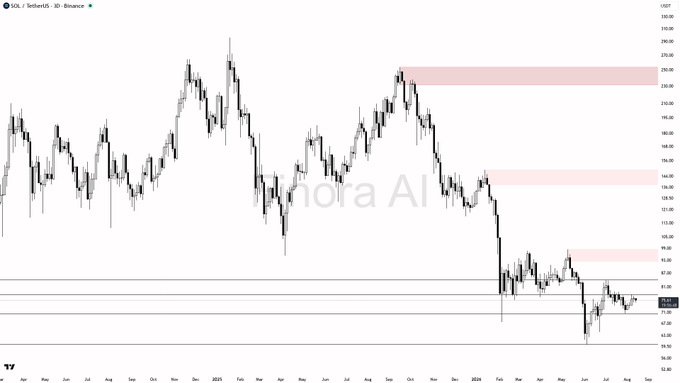
The chart shows a clear transition from the previous highs near $230. Sellers gradually established lower highs after each recovery attempt. Consequently, the broader structure shifted from expansion toward sustained downside pressure.
The decline accelerated after support near $125 eventually failed. Price then dropped toward $70 before entering a prolonged consolidation phase. That region has since become the main area where buyers attempt stabilization.
The latest structure continues to favor sellers beneath $83.98. Several rebounds have failed to establish sustained momentum above nearby resistance. Therefore, the current recovery remains vulnerable while the lower-high pattern persists.
$70.58 Defines the Immediate Setup
The post identifies $70.58 as the key support for the current three-day setup. A sweep beneath that level could create a potential reversal opportunity. However, the reclaim must occur quickly with convincing bullish price action.
Confirmation could come through a sharp reversal candle or lower-timeframe structure break. Such behavior would suggest that sellers failed to maintain control beneath support. The first recovery objective would then sit around $77.28.
A stronger rebound toward $83.98 would bring the major structural barrier back into focus. This level represents the latest significant swing high on the chart. Reaching it without sufficient momentum could invite another wave of selling.

The bearish alternative becomes clearer if $70.58 breaks without a reclaim. The post then identifies $62.96 as the next buyer interest area. A deeper decline could subsequently expose $60.13 as another important support.
Liquidations Reinforce Derivatives Risk
The perpetual liquidation chart shows substantial leverage across the market. The largest liquidation cluster appeared around late May and early June. Several green bars surged sharply as heavily leveraged long positions were forced out.
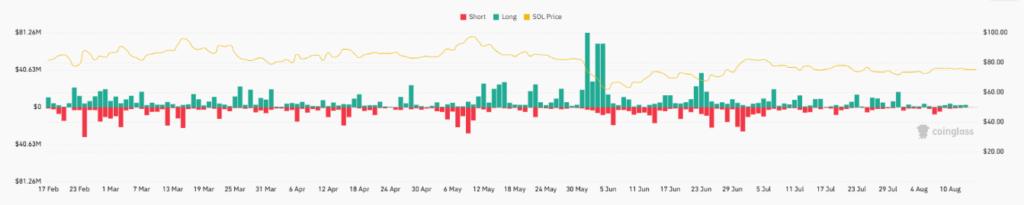
A large red liquidation bar followed that move shortly afterward. This showed that short positions were also caught during the rapid price reversal. The sequence reflects highly leveraged positioning rather than consistent directional control.
Exchange data shows considerable open interest across major trading venues. Gate leads with approximately $802.73 million, followed by Binance near $591.35 million. Bybit also holds substantial exposure at approximately $491.41 million.
A sustained three-day close above $83.98 would change the technical picture. Finora AI then projects $98.41 as the first upside target. Continued momentum could eventually expose $116.88 as the next major objective.
Until that breakout occurs, sellers retain the structural advantage. Conversely, a rejection above $83.98 could favor moves toward $77.28 and $70.58. The market therefore remains dependent on confirmation around these two boundaries.
As of writing, derivatives activity shows that leverage remains capable of producing sharp price swings. Meanwhile, the broader chart continues displaying a bearish structure beneath resistance. The next decisive move should come from either a confirmed $70.58 reclaim or sustained break above $83.98.