
- Shiba Inu trades at $0.00001302, holding support at $0.00001286 despite a 6.7% weekly decline.
- RSI stands at 58.71, showing moderate buying pressure, while MACD highlights gradual recovery momentum.
- Market cap remains at $7.58B, with resistance at $0.00001305 crucial for short-term trend direction.
The market activity of Shiba Inu has been an area of interest because the token is hovering around a critical support zone after recording volatility in the recent past. SHIB is trading at $0.00001302 which is a 6.7% decrease in the last 7 days.
Although the token has been retracing every week, the structural base of the token has been more than the support level of $0.00001286, and the resistance has developed at the level of $0.00001305. Market indicators are under scrutiny because trading volume is pointing to both positive and negative moods.
Price Stabilization Around Key Levels
SHIB has been moving in a tight range, moving between the support level of 0.00001286 and the resistance level of 0.00001305. This range is also significant with regard to short-term sentiment. It is important to note that the current price of the asset is marginally weaker than the previous lows. This is a consolidation area which analysts are tracking because it coincides with a greater accumulation phase noted on the long-term chart.
Additionally, the market cap of SHIB is reported at $7.58 billion, showing its persistence among leading tokens. However, the weekly decline highlights that upward continuation requires a stronger shift in demand. This price stability builds a base for possible momentum if volumes expand near resistance.
Technical Indicators Highlight Momentum
Indicators also give additional insight into the short-term outlook of SHIB. The Relative Strength Index (RSI) is 58.71 and this is higher than the midpoint value of 50. This implies a moderate purchasing power even though it has dropped in the recent past. The RSI has been repeating the actions of recovering past oversold areas, which gives a clue on the continued support in the market.
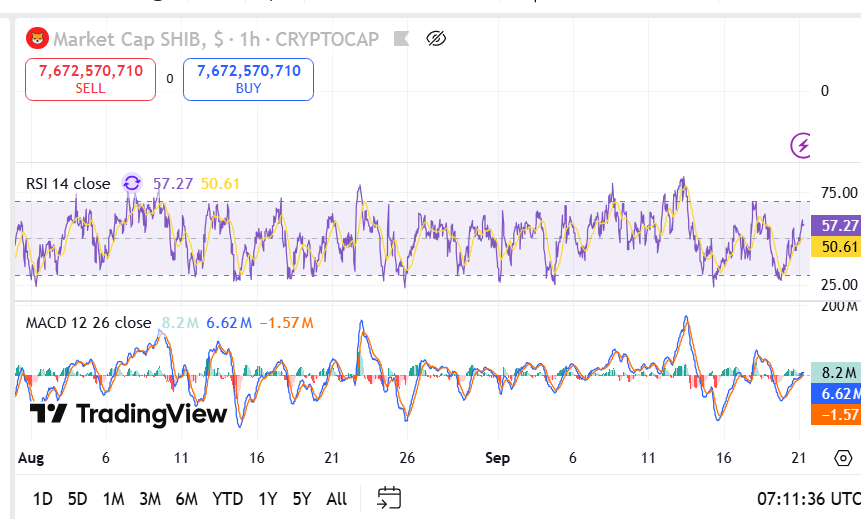
Similarly, the MACD reflects a slightly positive divergence. The current values show 9.06M against 5.56M, while the signal line remains at -3.5M. These levels suggest gradual recovery momentum as price attempts to challenge resistance. Market participants remain cautious, however, since minor corrections could still occur within the range.
Market Structure and Potential Trends
Examining the broader chart reveals that SHIB has been moving within a defined horizontal channel. The price action indicates repeated tests of both upper and lower boundaries, with the current level resting in a potential accumulation area. Historical data shows that similar setups preceded stronger market activity.
Furthermore, the token’s capitalization remains significant at 0.091124 BTC and 0.082904 ETH, underscoring its liquidity across trading pairs. This factor adds weight to SHIB’s potential moves if volume increases. The resistance at $0.00001305 will be closely observed as traders assess whether SHIB can build momentum beyond its short-term ceiling.
