
- SHIB recovery holds above key support as rising lows and trendline defense preserve a constructive short-term technical structure.
- RSI near 58.99 reflects improving momentum, while stronger volume remains necessary to confirm a sustained move through resistance.
- SHIB is met with resistance around $0.00000550 as additional resistance zones are seen around $0.00000600 and the previous spike zone above.
SHIB recovery remains in focus as buyers defend crucial support, while improving momentum and higher lows shape a developing technical structure on the daily chart.
Buyers Defend the $0.000005 Support Zone
SHIB is holding above $0.000005, maintaining an active psychological support area. The token recently bounced from lower levels and is trading around $0.00000545. This defense has been able to keep a constructive short-term price action despite the selling pressure earlier on.
The daily chart shows buyers gradually returning after SHIB approached the $0.0000040 region. Since then, price has started forming higher lows across the developing recovery. That structure suggests demand has strengthened during pullbacks compared with earlier summer trading.
SHIBMortal pointed to this renewed strength in a recent market update. The post noted SHIB’s defense of $0.000005 and improving momentum. It also described a potential breakout candle as the next major development.
However, holding support remains more important than a single intraday surge. Sustained trading above $0.000005 would preserve the current recovery framework. A breakdown below that zone could weaken the developing higher-low pattern.
Rising Trendline Supports the Recovery Structure
The ascending trendline from late-August lows has become a central technical reference. SHIB has repeatedly respected this rising support during recent consolidation. Consequently, the trendline now helps define the market’s immediate bullish structure.

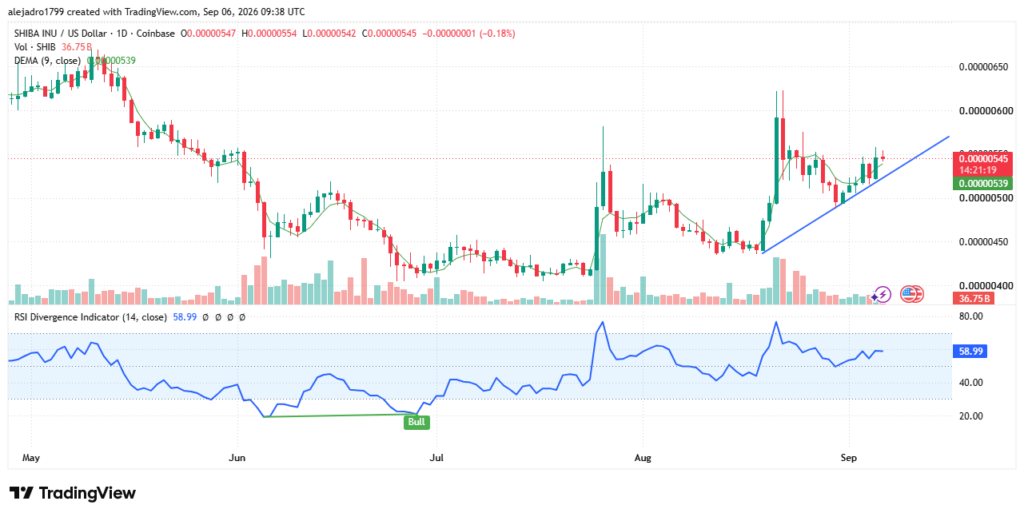
Price is also trading slightly above the nine-day DEMA near $0.00000539. This places the short-term average beneath the current price near $0.00000545. Therefore, the DEMA may provide additional support during moderate pullbacks.
Momentum readings have improved alongside the price structure. The RSI stands near 58.99, above the neutral 50 threshold. At that level, momentum remains positive without reaching traditionally overbought conditions.
The RSI recovery also contrasts with weaker readings recorded earlier during summer. Selling pressure has eased as buyers increasingly defend higher price levels. Still, momentum confirmation will depend on whether price can maintain its current trajectory.
Resistance and Volume Set the Next Test
Based on the chart above, the next resistance level is approximately $0.00000550. Above that, resistance extends toward the $0.00000570-$0.00000600 range. Those levels previously attracted sellers and capped upward attempts.
A decisive daily close beyond those barriers would strengthen the recovery setup. The next technical area would then include the upper resistance near $0.00000650. Yet any advance would require sustained participation rather than a brief price spike.
Volume increased during the stronger rallies visible in late July and August. Those expansions accompanied sharper upside moves and increased market participation. Therefore, another volume increase could help validate a breakout attempt.
Conversely, a loss of the rising trendline would change the immediate picture. That weakness could expose SHIB to the $0.00000480 area or lower. For now, support defense and resistance behavior remain the chart’s central technical signals.