
- SHIB defended a major long-term support zone while testing trendline resistance and improving weekly momentum indicators.
- Price held near $0.0000046 as MACD weakened bearish pressure and RSI stabilized below the neutral threshold.
- Fibonacci projections remain active, although confirmation still depends on a sustained breakout above resistance levels.
SHIB Price Outlook remains closely watched as Shiba Inu defends long-term support while testing resistance. Momentum indicators show improving conditions, although confirmation of a broader trend reversal remains pending.
Long-Term Support Continues Holding
The weekly chart presents SHIB’s market cycle since the 2021 rally. It tracks the following correction and prolonged consolidation. The structure identifies crash, retrace, and accumulation phases.
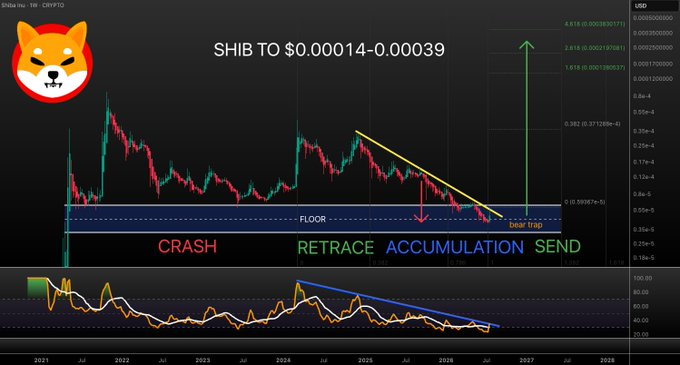
A broad blue support zone continues acting as the market floor. Price repeatedly tested this area without recording a weekly breakdown. Buyers have continued defending this level during recent weakness.
The chart also displays a descending resistance trendline from previous highs. Price has compressed beneath this barrier for several months. The narrowing structure suggests a decisive move may approach.
The shared market update appeared through a post by SHIBMortal. The post stated the floor remained intact despite resistance tests. It also noted the market still requires additional confirmation.
Momentum Indicators Show Improving Conditions
The weekly Relative Strength Index has flattened after a prolonged decline. A descending RSI resistance line remains under pressure. Momentum now appears stronger than during previous declines.
The chart links price action with improving weekly RSI behavior. Both indicators continue testing important technical barriers together. Traders often monitor such alignment before stronger directional moves.

Fibonacci extension levels are potential further targets for a confirmed upwards move. The range of projected targets is about $0.00014-$0.00039. Those levels remain technical projections instead of guaranteed outcomes.
The chart also marks a possible bear trap beneath support. Such formations often attract sellers before rapid recoveries. Confirmation still depends on sustained buying activity afterward.
SHIB Holds Near Immediate Support
The four hour chart gives further short term market context. SHIB was recently confirming its latest near $0.0000055, but has since been making its way into a corrective phase. It later settled at $0.0000046 as sales dropped.
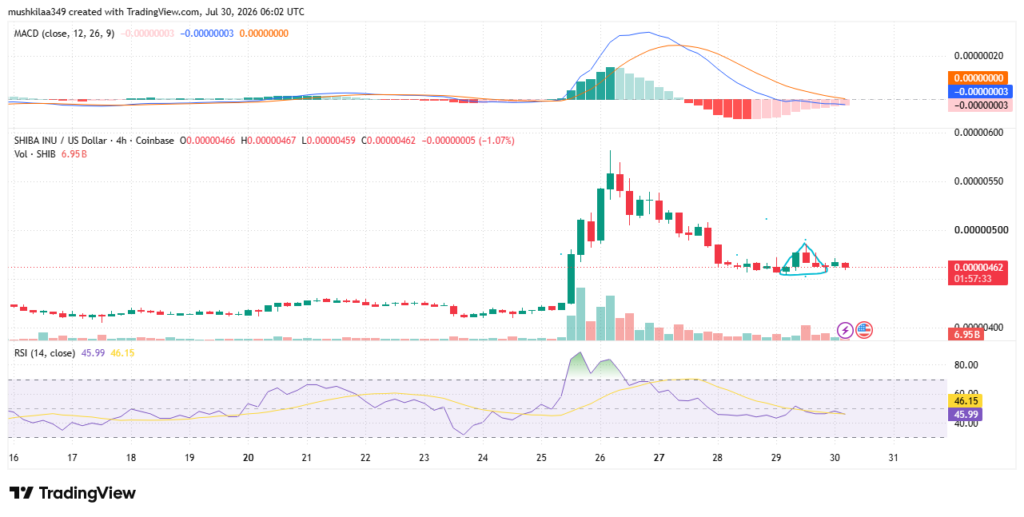
A rounded recovery pattern developed near the latest trading candles. Buyers briefly pushed price toward $0.0000049 before momentum weakened. The rebound therefore remains incomplete.
Trading volume declined after the earlier breakout accelerated higher. Reduced activity reflected lower participation during the correction. Stronger buying volume would improve breakout prospects.
MACD continues moving closer toward a possible bullish crossover. RSI, meanwhile, is still in near neutral territory at 45.6, which is below the neutral level of 50. The price remains above $0.0000046, and could provide a second resistance level at $0.0000050. If the breakout is successful, the previous swing high at $0.0000055 will be exposed, otherwise the consolidation will continue.