
- SHIB holds rising support while RSI stays above 50, keeping the recovery structure intact as buyers approach a key resistance zone.
- SHIB has seen its community grow to over 1.69 million addresses with continued growth, nearing the next milestone of 1.7 million as the addresses add up.
- Mixed exchange flows leave accumulation unconfirmed, while a break above $0.0000060 could strengthen recovery and shift market momentum.
SHIB price analysis shows a developing recovery as holder growth continues, momentum improves, and exchange flows remain mixed while the token approaches key resistance levels on the daily chart.
Holder Growth Brings SHIB Closer to 1.7 Million
BSCN reported that SHIB holders recently surpassed 1.69 million addresses. The report cited Etherscan data and more than 3,300 new holders. At that pace, BSCN suggested the 1.7 million milestone could approach within weeks.
More detailed figures placed the holder count at 1,693,365 addresses. That leaves 6,635 addresses before reaching 1.7 million. However, holder growth does not necessarily represent equivalent new capital entering SHIB.
Multiple wallets can belong to existing participants or larger holders. Therefore, address numbers provide distribution data rather than direct investment measurements. Still, continued growth keeps community expansion visible across the network.
The holder milestone also adds context to SHIB’s current market structure. Community participation remains closely associated with the token’s broader market identity. Yet, holder growth alone cannot establish future price direction.
Daily Chart Shows Rising Support
The chart as of writing shows SHIB trading around $0.000005838. Price has recovered from the approximately $0.0000050 region. Meanwhile, successive lows have formed along an ascending support trendline.
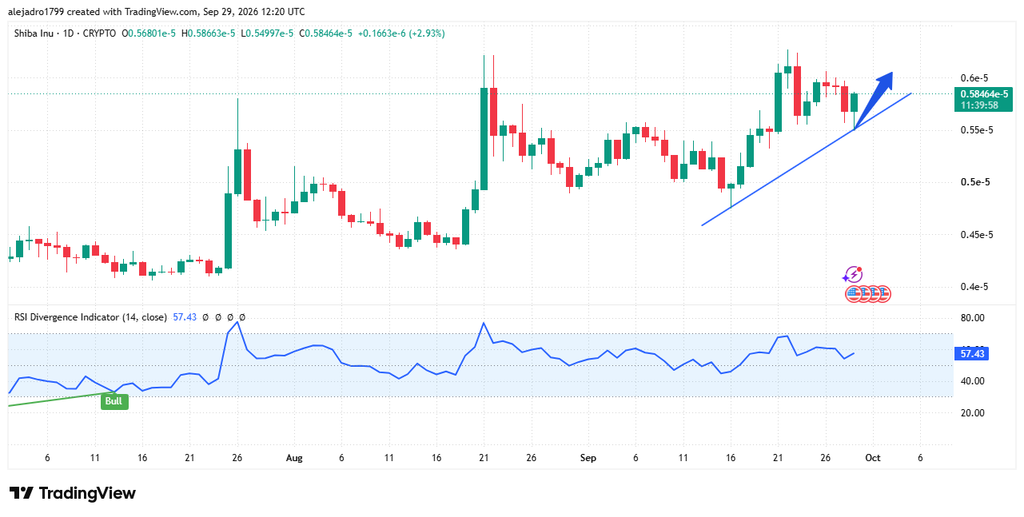
The structure shows buyers defending progressively higher levels during September. That trendline now provides an important reference for short-term price action. A sustained break below it could weaken the current recovery structure.

SHIB is also approaching the $0.0000060 resistance area. A daily close above that level could expose previous highs near $0.0000062. Repeated rejection there could instead keep the token within its current range.
The Relative Strength Index currently stands near 57.29. That places momentum above the neutral 50 level without reaching 70. Earlier bullish divergence signals also appeared during the June and July declines.
Exchange Flows Remain Mixed Around Recovery
The SHIB Spot Inflow/Outflow chart shows uneven exchange movements through September. Daily netflows frequently moved around the zero line. This indicates alternating transfers toward and away from exchanges.
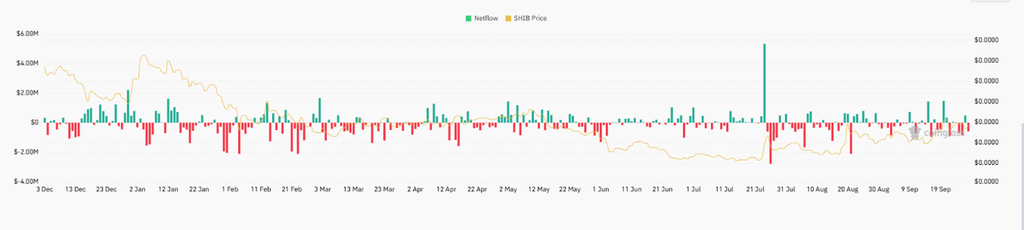
A major positive spike appeared during late July, exceeding $5 million. Such inflows can increase tokens available for potential exchange selling. However, the chart cannot confirm whether those transferred tokens were eventually sold.
Recent data continues showing both positive and negative netflow bars. There is no sustained sequence of large outflows establishing clear accumulation. Consequently, exchange activity remains an important but incomplete market signal.
Taken together, the indicators present a mixed but improving structure. Rising support and RSI above 50 favor continued monitoring of upside momentum. However, resistance near $0.0000060 remains the next technical test for SHIB.