

- A savvy trader turned $6.9M into $84.5M by riding OM’s 11x surge, capitalizing on market trends and timely exits.
- OM’s breakout past $7.50 confirms strong bullish momentum, supported by rising OBV, high trading volume, and structured patterns.
- With OM holding above $7 and key indicators bullish, market sentiment favors further gains, keeping buyers in control.
A smart trader, identified as 0x177e6, secured a massive $77 million profit from trading OM tokens in under a year. In March 2024, the trader acquired 11.5 million OM tokens from Binance at an average price of $0.63, totaling approximately $6.9 million. As OM surged to an all-time high (ATH) of $7.53, he began transferring his holdings to Binance through multiple addresses. If fully liquidated, the trader’s portfolio would be worth around $84.5 million, marking an 11x return on investment.
OM Price Movement and Market Trends
OM’s price movement displays a strong bullish trend, supported by rising open interest and high trading volume. Between August and October 2024, the price remained stable with minor fluctuations. However, mid-November saw a breakout, with OM experiencing a sharp upward surge. Open interest followed suit, peaking before declining sharply in early December.
After a brief pullback, the price established a new support level higher than previous ranges. From mid-December to early January, OM entered a consolidation phase as open interest stabilized. The second breakout in early February resulted in another price rally. The latest peak at $7.545 solidified the asset’s bullish momentum.

Source: Santiment
Technical Indicators and Market Structure
OM’s 4-hour chart reveals a rising channel pattern, with price action forming higher highs and higher lows. A significant breakout near the channel’s upper boundary confirms strong bullish momentum. The 50-period exponential moving average (EMA) slopes upward, supporting the trend. OM’s price consistently trades above the EMA, signaling sustained buying interest.
The accumulation/distribution (Accum/Dist) indicator trends upward, reflecting strong capital inflow. On-balance volume (OBV) also rises, confirming continued buying pressure. A major spike in both indicators coincides with the price surge, reinforcing bullish dominance.
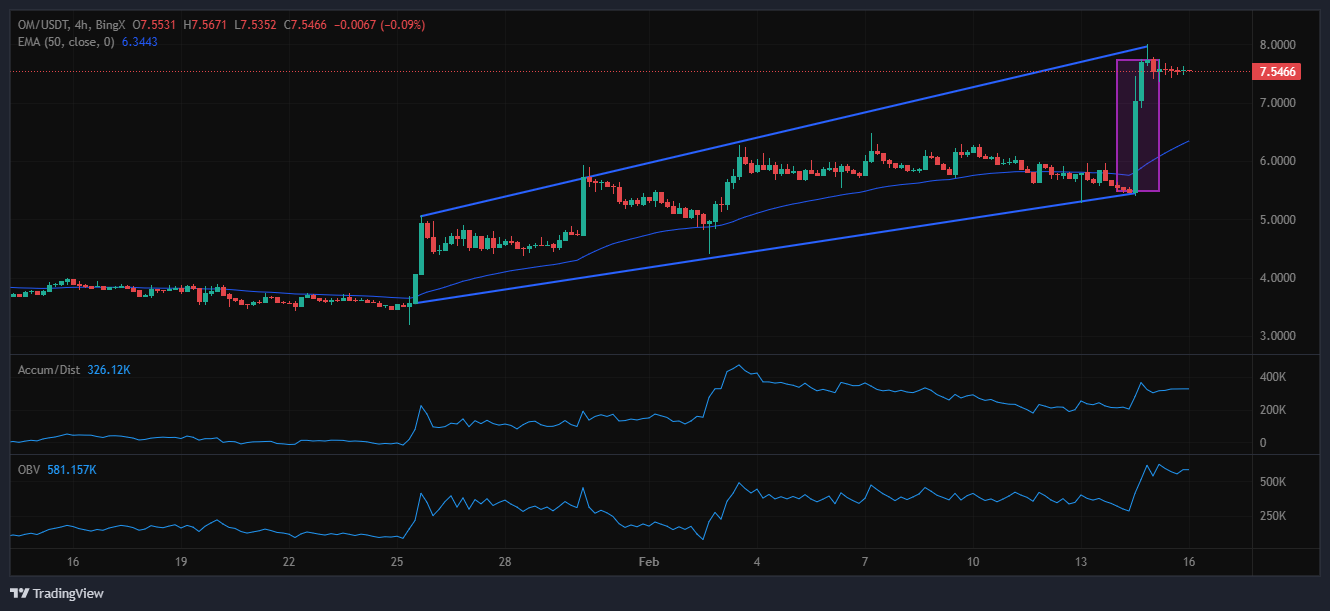
Source: Bingx
After breaking out, OM entered a consolidation phase at around $7.50. The previous breakout level near $6 now acts as support. The market reaction remains strong, with no immediate reversal patterns. The trendline support from the rising channel aligns with price reactions, confirming a structured pattern.
Moreover, increasing trading activity and expanding OBV indicate strong market participation. With the EMA positioned below the price, bullish momentum remains intact. As long as OM holds above $7, bulls maintain control, with the potential for further gains in the near term.