
- PEPE is trading at $0.053571 and it is within the tight range of $0.053437-$0.053771 during the day but it is making a 3.5 percent one-day gain.
- The one-hour chart shows momentum in the form of RSI at 53.75 and compressed MACD histogram bars.
- Minor profits against BTC and ETH are a positive indicator of the strength of the price, although the price level of 0.053771 has not been overcome.
At the time of writing, Pepe was trading at $0.053571, with a 3.5 percent increase in the last 24 hours. The token also gained 0.6 percent against Bitcoin to 0.0105380 BTC and against Ethereum to 0.081803 ETH. Although this has increased, the price is still within a narrow intraday range.
There is compression in the 24-hour structure between the distinctly supportable prices at $0.053437 and resistance at price at $0.053771. Therefore, the short-term orientation is subject to the reaction of the price at the specified levels, and the further picture of a possible shift to the level of $0.01 is hypothetical in the current range.
Narrow 24-Hour Range Defines Immediate Structure
Price is still going back and forth between $0.053437 and $0.053771 creating a narrow horizontal range. Interestingly, the amount of $0.053437 was supported in the recent pullbacks by the buyer. Each dip toward that zone attracted demand, preventing deeper intraday losses.
However, sellers capped advances near $0.053771. As a result, upside attempts stalled before establishing expansion beyond resistance. The tight spread between support and resistance reflects limited volatility during the session.
Moreover, the 3.5% daily gain occurred within this confined band. Therefore, momentum has increased, yet price has not cleared the upper boundary. This dynamic keeps the range intact for now.
One-Hour Chart Shows Oscillator Swings
On the one-hour Binance chart, oscillators fluctuate around mid-level readings. The upper panel displays repeated momentum waves, with recent values near 53.75 and 41.16. These figures indicate alternating buying and selling pressure.
Earlier spikes pushed the indicator higher; however, pullbacks quickly followed. This pattern reinforces short-term mean reversion rather than sustained trending behavior. Additionally, the lower indicator panel shows brief histogram expansions that faded rapidly.
Technical Indicators Show Compression Within Narrow Range
The one-hour chart displays an RSI reading near 53.75, while a secondary smoothing line tracks near 41.16. Notably, RSI recently rebounded from lower levels before crossing above the midpoint. This move reflects improving short-term momentum.
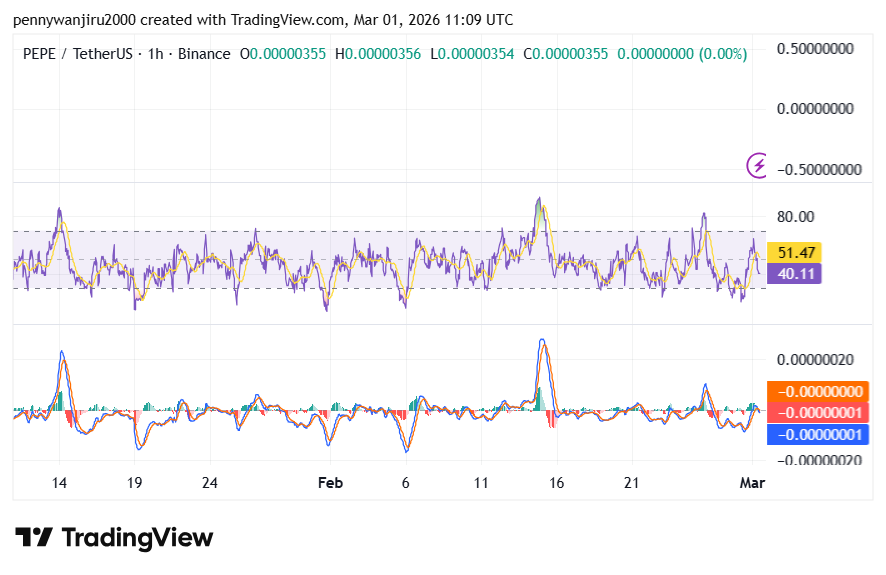
Below price, the MACD panel shows brief histogram expansions above and below zero. Recent bars remain small, which indicates moderate momentum strength. Furthermore, the MACD line and signal line move closely together. Because histogram bars remain compressed, volatility also appears contained. Therefore, indicator structure matches the tight $0.053437 to $0.053771 band.
Cross-Pair Performance Adds Context
PEPE is trading at 0.0105380 BTC against Bitcoin, which is a 0.6% upsurge. In the meantime, the 3.0 percent increase against Ethereum puts the two at 0.081803 ETH. These relative advances carry the 24-hour dollar increase in price.
Nevertheless, cross-pair gains remain modest compared to the narrow dollar range. Therefore, broader market participation appears measured rather than aggressive.
If price breaks above $0.053771, intraday expansion could test higher prints within today’s session. Conversely, rejection at resistance may return price toward $0.053437, keeping the range structure active.
