
- PEPE trades at $0.054497 after a 3.4% daily rise, staying within a very tight intraday range.
- Support at $0.054341 continues to anchor the lower boundary of the current price structure.
- Resistance at $0.054585 forms a narrow ceiling, keeping PEPE confined between two close levels.
PEPE continued to trade within a narrow band during the latest session, and its market behavior remained tightly aligned with the current price structure. The asset now trades at $0.054497 after posting a 3.4% gain over the past 24 hours. This shift places PEPE close to its immediate resistance while keeping it above the stated support level at $0.054341.
The range between support and resistance remains unusually tight, and the 1-hour market cap chart reflects consistent oscillations across recent weeks. These conditions shape the market’s short-term focus because traders now monitor how price reacts while staying inside a compressed structure.
PEPE Holds Steady in a Tight Range as Indicators Signal Mild Bullish Momentum
The current $0.054341 to $0.054585 range defines PEPE’s near-term behavior. Price has held within this zone across multiple sessions, which creates a contained environment for short-term tracking. The 24-hour increase of 3.4% lifted the asset toward the upper boundary at $0.054585, which now stands as the next barrier.
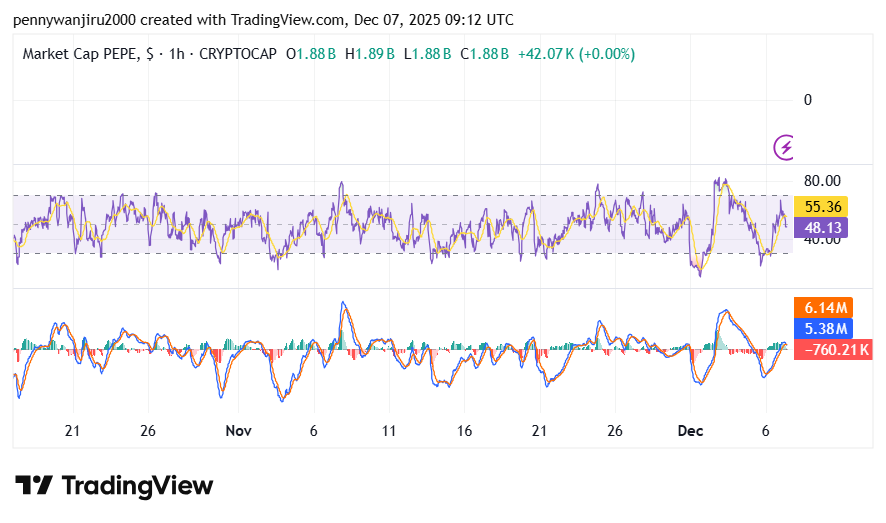
However, the move remained measured, and the price did not break outside the defined range. The RSI was trading at 55.38 which shows the coin was in a neutral momentum neither overbought nor oversold. Moreover, the MACD line is trading above the signal line indicating bullish momentum. This pattern maintains interest in how PEPE behaves if it revisits its lower range limit during upcoming sessions.
Tight Market Conditions Shape PEPE’s Short-Term Trading Rhythm
The support level at $0.054341 continues to anchor the market structure. Price stayed above this mark despite multiple intraday pulls, and the recent increase strengthened the short-term position. The tight spacing between support and resistance adds importance to this lower boundary. However, the presence of steady oscillations suggests that price continues to dip toward mid-range levels before returning upward.
The resistance level at $0.054585 sits only slightly above the current price, creating a very narrow ceiling. Price reached near this upper boundary after the 3.4% daily rise but remained inside the defined band. This proximity shapes the near-term view because any movement toward the level provides a clear reference for market observers. However, the market cap chart shows consistent swings rather than extended directional moves, which reinforces the importance of tracking reactions at this upper level.
