
- PEPE incurred only green hourly candles, but stayed above the $ 0.054906 support level the entire session.
- Price was held down to below the resistance of over $0.055086 which restricted the trading to a small intraday range.
- The momentum indicators remained neutral with RSI around 50 and small MACD histogram growth, on the one-hour chart.
PEPE has been trading up in the last session, and has only had green hourly candles with a thin intraday range. The meme-token traded at the rate of $0.054982 which represented a 1.5% upsurge throughout the session. This trend was increasing as PEPE was above its short-term support of $0.054906.
The trading activity remained within the prescribed support and resistance margins signifying a controlled price environment as opposed to expansion. PEPE also recorded gains that were modest against Bitcoin and Ethereum, which further supports the upward bias that was present throughout the session.
PEPE Maintains Range as Price Tests Immediate Resistance
Interestingly, PEPE was trading with a narrow 24-hour range that was limited by a resistance at $0.055086. The price action was also well-organized as every rise had the same upper limit. Nonetheless, the amount of resistance remained high to restrain an increasing trend throughout the session.
In the meantime, recurrent defenses of the level of $0.054906 defied the short-term structure. The day market was influenced by this equilibrium between support and resistance. Consequently, price stability turned out to be the trend in the next observation period.
Momentum Indicators Reflect Neutral Market Conditions
However, momentum indicators on the one-hour chart suggested neutral conditions rather than acceleration. The Relative Strength Index hovered near the 43.58 midpoint, fluctuating around the 50 level. The selling and buying pressure indicated a balance in this reading.
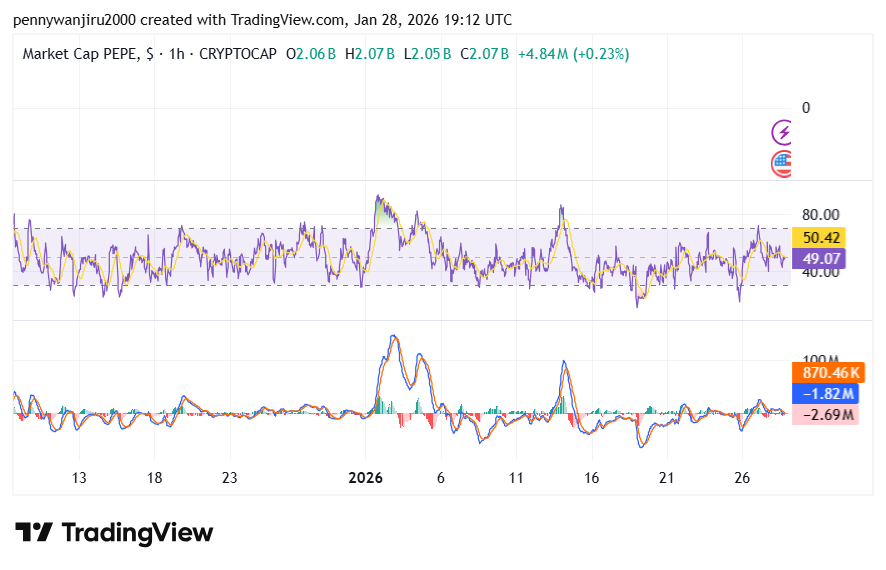
Meanwhile, the Moving Average Convergence Divergence exhibited shallow movements of histograms. The MACD lines were not sharp in terms of their directional separation, although each was very close to the other. Therefore, the momentum remained low as price increased at a slow pace.
Volume Fluctuations Align With Controlled Price Action
Meanwhile, volume activity followed a measured pattern throughout the session. Trading volume showed brief spikes but lacked sustained expansion. These fluctuations aligned with the narrow price movement visible on the chart.
Additionally, market capitalization data reflected limited variation, remaining near $2.06 billion during the period. This stability supported the controlled price behavior observed. As price held within defined levels, volume reinforced the absence of volatility rather than signaling directional change.
