- PENGU is compressing beneath a long-term descending trendline after months of lower highs and lower lows across the chart.
- A sustained daily close above resistance could shift the structure, while another rejection would preserve the established downtrend.
- PEPE remains range-bound as buyers defend support and sellers continue blocking advances near the upper resistance zone.
PENGU is approaching a major technical barrier after months of consolidation, while PEPE remains locked between defined intraday support and resistance levels.
PENGU Nears a Long-Term Resistance Barrier
ZAYK Charts recently described PENGU as seemingly ready for a breakout. The observation focused on the daily timeframe and descending trendline. That trendline has controlled several recovery attempts across the broader downtrend.
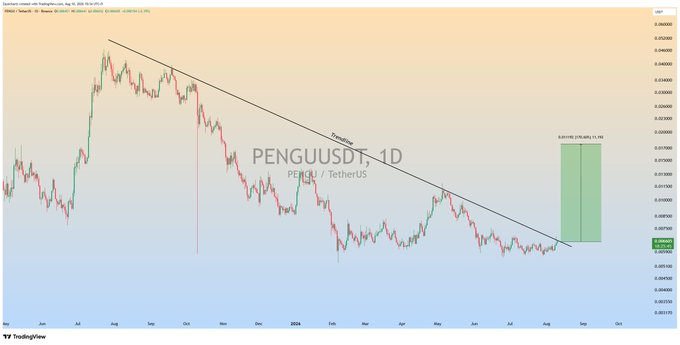
The chart shows a strong rally during the middle of last year. Sellers then established a sequence of lower highs and lower lows. Those reactions gradually created the descending resistance line visible across multiple months.
Recent candles show tighter movement near the lower trading range. Selling pressure has also become less aggressive than earlier decline phases. Meanwhile, repeated consolidation attempts suggest buyers continue defending the lower area.
The May rebound provides an important reference for the current setup. PENGU rallied sharply before reaching the descending trendline and reversing. However, the following decline lacked the intensity of earlier selloffs.
Breakout Confirmation Could Change the Structure
The descending trendline remains the primary resistance level for PENGU. Several historical reactions have reinforced that barrier as technically important. A sustained daily close above it would provide stronger breakout confirmation.
The chart displays a green projection zone above the current trading region. This area represents the potential path following a confirmed resistance break. However, the projection remains a technical target rather than an assured destination.

A brief move above resistance would provide weaker confirmation for the setup. Sellers could still push the token back beneath the trendline. Therefore, continued trading above resistance would matter more than an isolated price wick.
Failure at the trendline would preserve the broader bearish structure. Price could then return toward the established consolidation zone. The next daily candles should therefore determine whether compression develops into expansion.
PEPE Holds Inside a Narrow Range
PEPE presents a shorter-term structure with clearly defined boundaries. The supplied chart places its current price around $0.0000052879. The token has gained 0.57% over 24 hours, while volume increased by more than 50%.
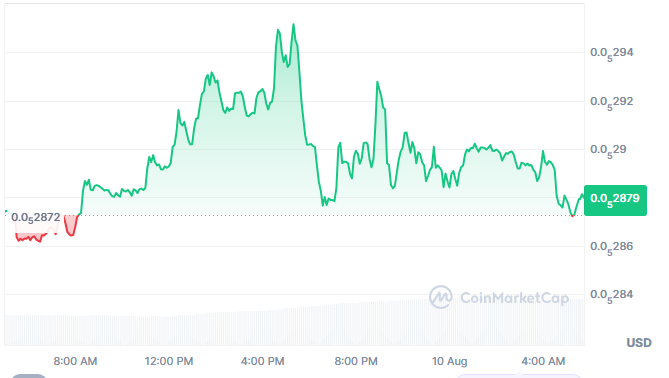
Price initially advanced from approximately $0.000005286–$0.000005287. Buyers later pushed the token toward $0.000005294–$0.000005295. Sellers then rejected that move and returned the price toward the lower range.
The immediate resistance zone sits between $0.000005292 and $0.000005295. Multiple tests have failed to produce a sustained break above that area. Meanwhile, support remains concentrated around $0.000005287–$0.000005288.
A break above resistance could strengthen PEPE’s short-term bullish structure. Conversely, losing support would weaken the current recovery and expose lower levels. The chart therefore leaves both tokens facing clearly defined technical decision points.