- PENGU Breakout is testing a major higher-timeframe descending trendline after recovering nearly 91% from its earlier accumulation zone.
- Confirmation requires a clean breakout, acceptance above resistance, and a successful retest before higher resistance targets come into focus.
- The higher-timeframe setup remains valid while PENGU holds above the major $0.0055 support level identified on the chart.
PENGU Breakout has reached a decisive higher-timeframe resistance after months of recovery. Traders are watching whether price confirms a structural breakout before the next projected resistance zones become active.
Higher-Timeframe Trendline Becomes the Main Technical Focus
Crypto Patel shared a higher-timeframe PENGU chart outlining the current recovery structure. The chart centers on a descending trendline that capped previous rallies. That resistance now faces another breakout attempt.
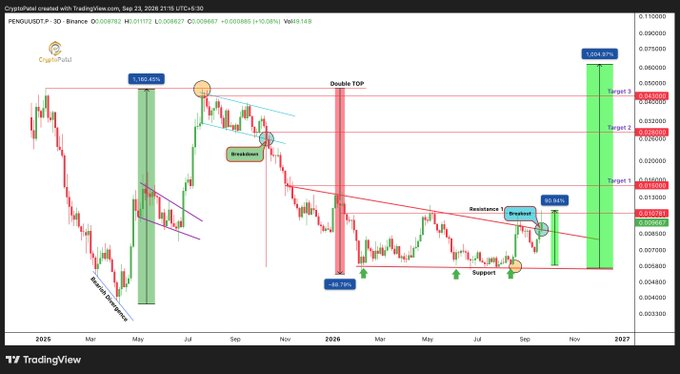
PENGU as of writing trades at around $0.01117 after recovering roughly 91% from its entry zone. The rally lifted price away from long-term support without changing the broader structure. Price has now returned to the defining resistance area.
The descending trendline originates from the previous macro high. Multiple lower highs formed beneath that line across several months. That pattern kept the long-term trend bearish until the current recovery.
Crypto Patel described this stage as a confirmation test rather than a completed breakout. A single candle above resistance does not complete the setup. The higher timeframe still requires additional validation.
Breakout Confirmation Opens Multiple Resistance Targets
The chart identifies $0.0090 as the breakout confirmation level. Holding above that reclaimed zone strengthens the recovery structure. Buyers would then defend previous resistance during a retest.
Crypto Patel expects acceptance above the trendline before targeting higher levels. The preferred sequence includes breakout, consolidation, and successful retest. That process confirms resistance has become support.

The first upside target appears near $0.015 after confirmation. The second target sits around $0.028, matching an earlier supply zone. Both levels correspond with historical resistance during the previous cycle.
Higher targets extend toward $0.043 and $0.060 on the roadmap. Those zones align with previous distribution levels and macro resistance. The chart presents them as sequential objectives after confirmed structure changes.
Macro Support Remains the Invalidation Level
The broader chart also measures the previous market cycle. PENGU declined roughly 89% from its macro high near $0.047-$0.048. That decline eventually produced a prolonged accumulation phase.
Repeated buying reactions developed around $0.0055 during consolidation. The chart labels that area as major higher-timeframe support. Every recovery attempt began after buyers defended that floor.
The post also compares the current setup with an earlier breakout. PENGU previously rallied more than 1,100% after escaping a falling structure. The present pattern shows another extended consolidation beneath descending resistance.
The analysis keeps invalidation clearly defined beneath major support. A sustained loss of $0.0055 would weaken the higher-timeframe recovery structure. Until then, the chart keeps the breakout roadmap conditional on confirmation above resistance.