
- NEAR broke below support at $2.237 after failing to hold gains, opening room for a possible drop toward the $2.08 zone.
- A bearish structure shift followed a sharp rejection from the $2.60–$2.70 range, confirming continued downside pressure.
- Weekly charts suggest a base forming between $1.80 and $2.00, with upside potential toward $7–$13 as momentum gradually improves.
NEAR Protocol was rejected from key resistance and trades below a critical support level, indicating possible near-term downside. While lower timeframes show a bearish structure forming, higher timeframes reveal signs of a potential long-term reversal.
Liquidity Targets and Bearish Structure Shift
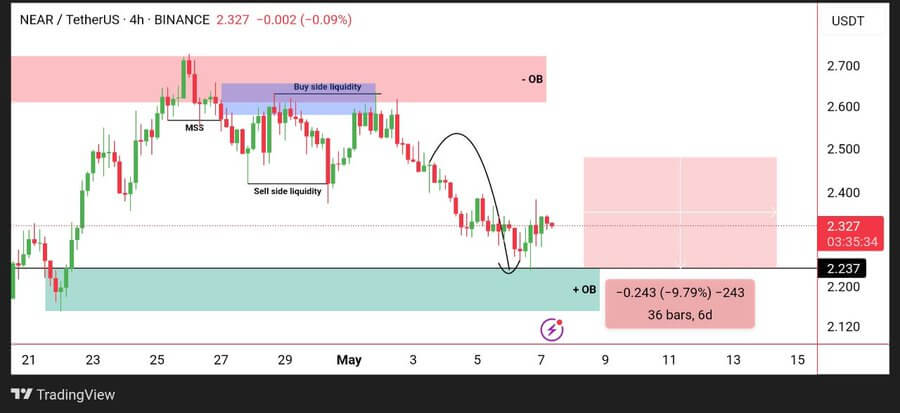
One bearish analyst, Crypto Patel, has presented a detailed analysis. His 4-hour chart shows NEAR/USDT declining after hitting a local peak near $2.56. The pullback followed a liquidity sweep and market structure shift, confirming bearish pressure.
Source: Crypto Patel
According to Crypto Patel, NEAR was rejected from a supply zone between $2.600 and $2.700. This reversal confirmed bearish control as the price dropped toward a bullish order block near $2.220. He has provided insights into the recent bounce at $2.237, identifying it as a key support level within the demand zone.
Price rebounded from this level but failed to establish higher highs, suggesting continued downside pressure. His projection points to a target at $2.084, reflecting a potential 9.79% decline over six days. The forecast uses a red shaded zone to mark the anticipated drop from current levels.

The analysis highlights how buy-side liquidity between $2.480 and $2.560 was targeted before the reversal. Meanwhile, sell-side stops below $2.380 were swept to trigger further downside. He emphasizes the importance of the $2.237 level in maintaining any short-term support.
Macro Chart Shows Multi-Year Bottom Formation
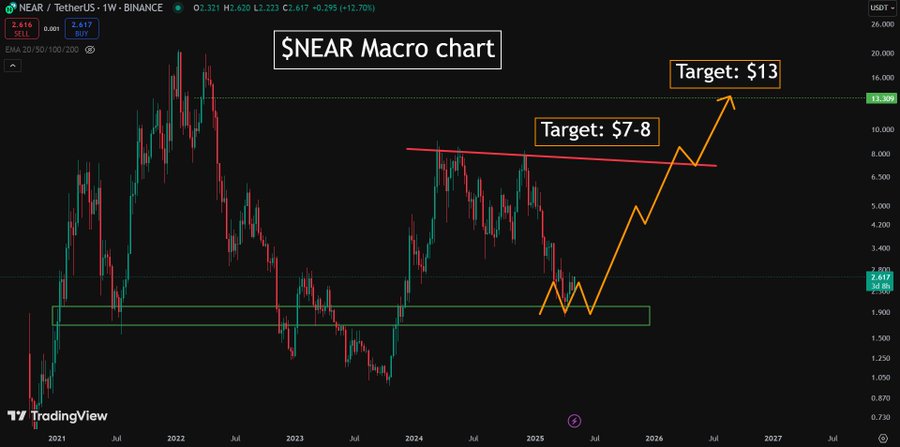
That said, there’s another side to consider. Bullish analyst Solberg Invest has provided a long-term chart that supports a possible reversal. His weekly timeframe outlines a base forming between $1.80 and $2.00 with repeated bounces.
Source: Solberg Invest
According to Solberg Invest, this zone has held strong support since 2022. His projected path outlines a W-shaped reversal from the 2023–2025 base, with upside targets at $7–$8. Not only that, but there’s also a longer-term target near $13, supported by historical resistance from 2021.
He has presented a breakout thesis based on higher lows and improving momentum above key moving averages. While short-term pressure remains, the broader trend suggests potential for recovery. This divergence highlights the split between intraday weakness and macro structure strength.
