- Bitcoin dominance chart shows steady growth to 58.14%, with resistance at 60% and 68%.
- Volume expansion and RSI divergence reflect strengthening market conditions and increased participation.
- Correlation with the 3M bullish chart suggests Bitcoin’s potential to exceed $100K and reach $175K.
The macro Bitcoin dominance chart has been updated, revealing key signals that suggest further upside potential for Bitcoin. Observations from volume expansion and the Relative Strength Index (RSI) divergence align with broader bullish patterns. These indicators support projections of significant price increases, with targets potentially exceeding $100,000 and even reaching $175,000, according to the 3-month (3M) bullish chart.
Volume Expansion Reflects Growing Market Participation
The updated dominance chart by RAFAELA RIGO on the X Space highlights a notable expansion in volume, reflecting increased activity within the Bitcoin market. The detailed chart observes that the dominance level has risen steadily, currently around 58.14%, with resistance levels visible near 60% and 68%.
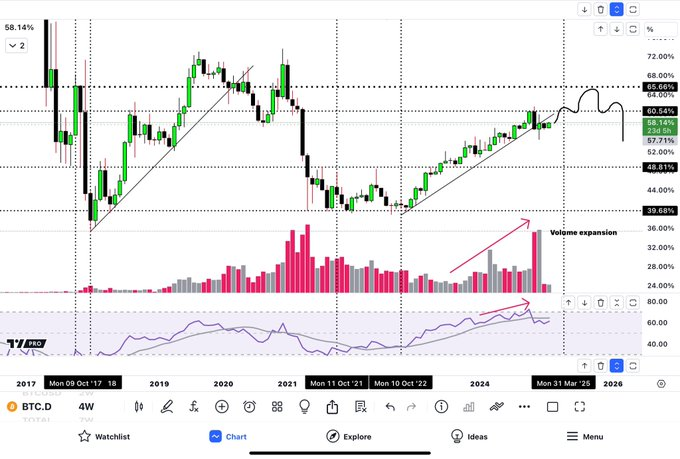
The volume expansion indicates increased market participation, while the RSI is trending upward, reflecting strengthening conditions. This move occurs when price movements and RSI trends move in opposite directions, signaling potential reversals or continuation patterns. In this case, the divergence supports expectations of further upward movement, reinforcing Bitcoin’s bullish outlook.

Historical data shows previous pullbacks followed by continued dominance growth, forming a consistent pattern. Key resistance zones suggest potential challenges ahead, but the combination of higher dominance and rising volume signals strong market interest.
According to the chart, higher trading volumes mostly point to heightened market interest and participation, which are typically precursors to price growth. This expansion underpins the bullish case for Bitcoin and aligns with broader market trends, pointing toward sustained upward momentum.
Correlation with 3M Bullish Chart
The signals from the dominance chart align closely with the 3M bullish chart, which suggests Bitcoin’s price could move beyond $100,000. The long-term chart highlights upward trajectories and reinforces the possibility of significant growth. Analysts are monitoring whether these macro-level patterns can sustain the necessary momentum to achieve targets as high as $175,000.