
Key Insights
- Spot LINK exchange-traded funds recorded $532,900 in inflows on Wednesday, signaling renewed institutional participation after nearly two weeks of inactivity.
- Chainlink network activity increased sharply as active addresses, transaction volume, and futures open interest climbed steadily throughout the ongoing rally.
- LINK reclaimed major moving averages near $10 while bullish momentum indicators strengthened despite resistance remaining between $10.77 and $12.85.
Chainlink climbed near $10 on Thursday after gaining almost 10% this week and breaking above several technical resistance levels. The rally followed a return of institutional demand and stronger network activity across the blockchain. Besides improving price action, derivatives data, and rising wallet activity showed that traders continue to increase exposure to LINK during the current recovery phase.
Institutional Interest Builds Around Chainlink
Data from SoSoValue showed spot LINK exchange-traded funds recorded inflows worth $532,900 on Wednesday after remaining inactive for nearly two weeks. Consequently, the renewed capital movement added fresh optimism to the market as traders monitored whether institutional participation could accelerate further through the week.
State Street Investment Management and Galaxy Asset Management also introduced the State Street Galaxy Onchain Liquidity Sweep Fund, called SWEEP, earlier this week. The tokenized liquidity fund uses Chainlink’s NAVLink system to deliver on-chain net asset value data, while the Cross Chain Interoperability Protocol supports cross-chain connectivity between networks.
On-chain Activity Signals Stronger Participation
Santiment data showed daily active addresses, transaction volume, and network growth rising steadily since early May. Additionally, the increase in these indicators reflected growing user participation across the Chainlink network and supported expectations of continued upward price movement in the near term.

Derivatives traders also increased their positions during the latest rally. CoinGlass data showed Chainlink futures open interest climbed to $495.74 million on Thursday from $366 million recorded on Sunday. Hence, the sharp increase suggested fresh money entered the market while traders positioned for additional upside.
Technical Setup Points Toward More Resistance Tests
Chainlink traded around $10.10 at press time while holding above the 50-day and 100-day exponential moving averages at $9.29 and $9.84. However, the token still traded below the 200-day exponential moving average near $11.50, which continued to limit the broader trend.
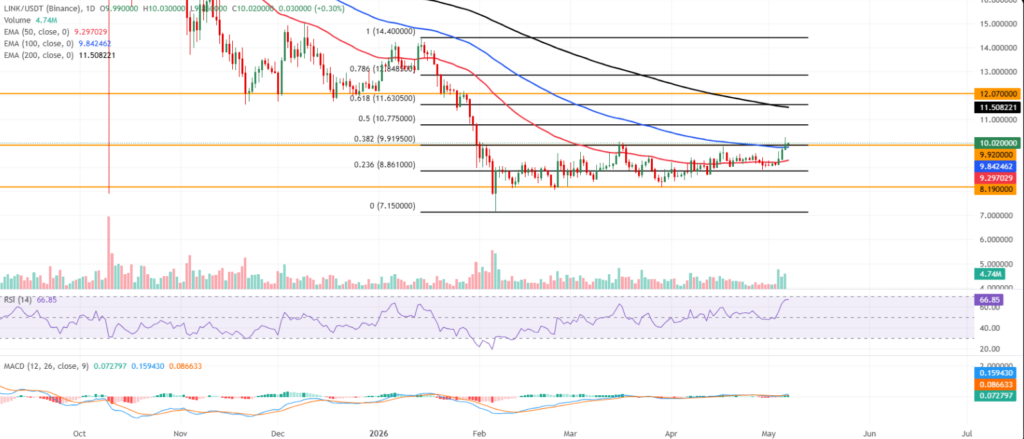
The relative strength index hovered near 66 on the daily chart and approached overbought territory. Moreover, the moving average convergence divergence indicator remained positive with expanding histogram bars, showing that bullish momentum continued building despite strong overhead resistance between $10.77 and $12.85.
Analysts continue watching the $9.92 support area, which aligns with a horizontal floor and the 38.2% Fibonacci retracement level. Additionally, the 100-day exponential moving average near $9.84 remains a support zone during any pullback. If sellers regain control, LINK could revisit the 50-day exponential moving average near $9.29 before testing support around $8.86.
