
- The global cryptocurrency market has increased by 3.55% during the last day, reaching a market capitalization of $2.01 trillion.
- Jupiter Coin’s value increased by 8.66% to $0.8675, despite a weekly price fluctuation and 17.89% loss.
- The MACD and RSI indicators imply potential price recovery, although present trends suggest bearish momentum.
Based on the daily charts, Jupiter Coin has seen an impressive rise of 8.66% in its value. The market has shifted from a solid daily bearish support level of $0.7931 to a bullish resistance level of $0.90, showcasing a substantial rise in price performance. This improvement is evident from the $0.20 price difference, which occurred in a short period of time.
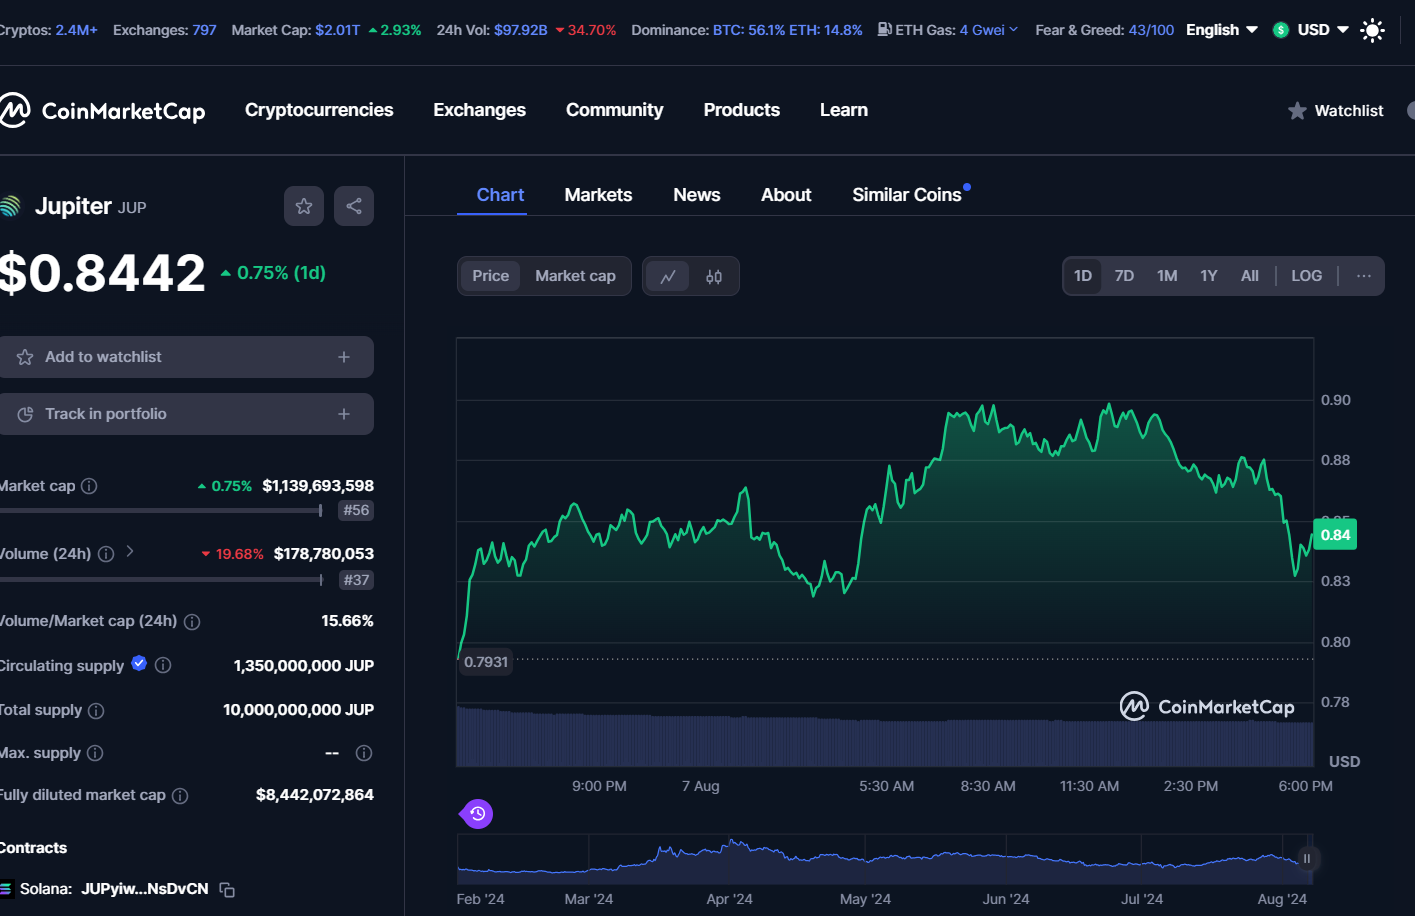
Source : coinmarketcap
Despite a constant rise, there has been some differentiation in the token’s trajectory, as seen in the weekly charts. These charts indicate a strong bearish trend, resulting in a weekly price reduction of 17.89%. This demonstrates that despite the daily increase, Jupiter’s market price is experiencing substantial swings as of press time. According to the latest CoinMarketCap data, the coin is right now valued at $0.8675 with a market capitalization of $1,170,186,069, reflecting an 8.58% increase. However, trading volume has decreased by 25.84%, totaling $183,746,781.
Jupiter Coin Rises 4.10% But Faces High Volatility and Bearish Trends
Jupiter Coin Rises 4.10% But Faces High Volatility and Bearish Trends
Turning to the JUP/USD daily chart on TradingView, the price is currently at $0.827, reflecting a 4.10% increase in the past 24 hours. The price has recently rebounded from the lower trendline, indicating support at this level. The chart highlights key support and resistance levels marked by a yellow line, ranging from $0.4426 to $1.8574. This range showcases the market’s potential for rapid changes and underscores the high volatility currently being experienced.
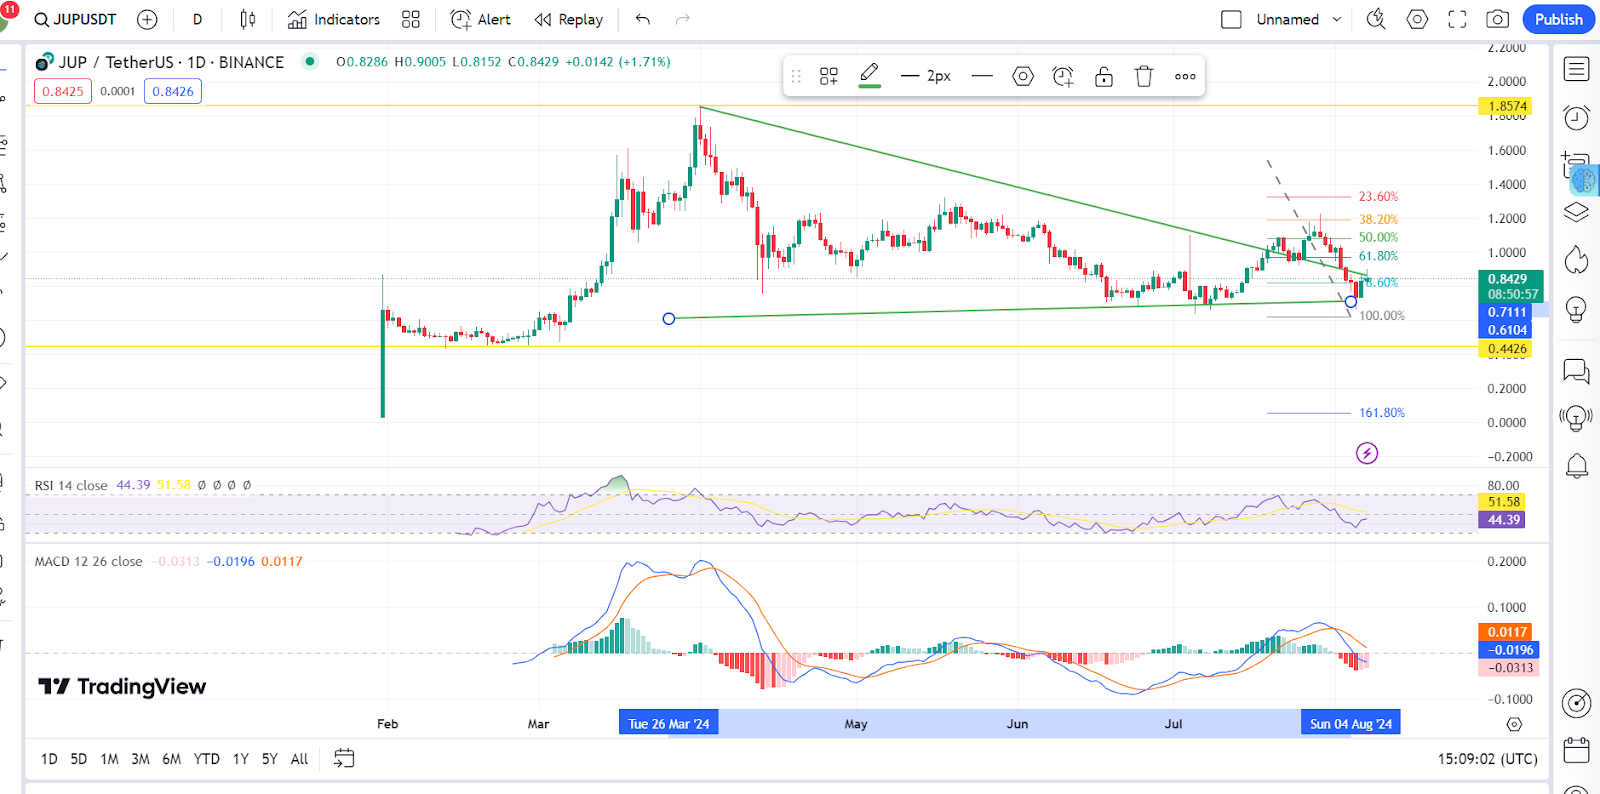
Source: tradingview
Read CRYPTONEWSLAND onThe Fibonacci retracement levels are currently indicating a high possibility of market fluctuations. The price is presently interacting with the 61.8% retracement level of $0.6104, which is a sensitive area often associated with strong support or resistance. Additionally, the 50% retracement level serves as another key support area, suggesting the market could potentially head downward.
The Relative Strength Index (RSI) is currently at 51.69, close to the neutral zone, indicating a balance of buying and selling pressures. But if it breaks above 60 and enters overbought territory, the small uptick at the end points to a possible shift towards bullish momentum. The moving average and the MACD line are both trending lower, indicating a downward movement in the MACD indicator. The MACD histogram is also displaying red bars, indicating bearish momentum in the market. If this trajectory continues, a potential rebound could occur, leading to a price recovery
disclaimer read moreCrypto News Land, also abbreviated as "CNL", is an independent media entity - we are not affiliated with any company in the blockchain and cryptocurrency industry. We aim to provide fresh and relevant content that will help build up the crypto space since we believe in its potential to impact the world for the better. All of our news sources are credible and accurate as we know it, although we do not make any warranty as to the validity of their statements as well as their motive behind it. While we make sure to double-check the veracity of information from our sources, we do not make any assurances as to the timeliness and completeness of any information in our website as provided by our sources. Moreover, we disclaim any information on our website as investment or financial advice. We encourage all visitors to do your own research and consult with an expert in the relevant subject before making any investment or trading decision.