
- Intel is trading in a long base pattern that suggests strong interest near the $21 price level.
- The $26.20 resistance remains the most important area that traders believe could trigger a strong move.
- Buyers have shown up at each support test which points to strength and a potential shift in trend.
Intel Corporation (NASDAQ: INTC) remains range-bound below the $26.20 resistance, showing a potential Wyckoff accumulation pattern on the weekly chart. Shared by Mr. Chart Norris, the setup features classic consolidation behavior following a sharp decline in 2024. The current price at $21.38 places the stock in a narrow band with signs of building upward momentum.
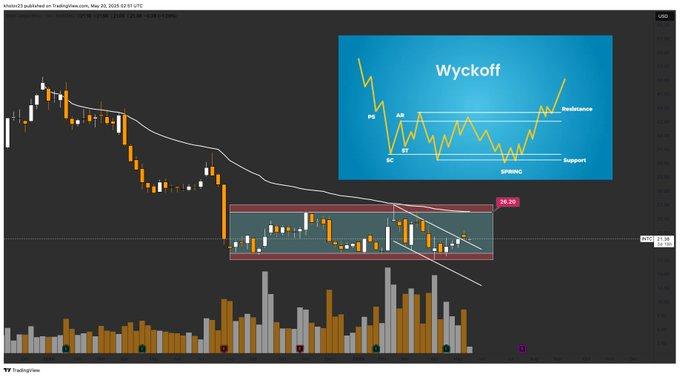
Wyckoff Structure Points to Potential Trend Reversal
The chart presents a textbook Wyckoff accumulation phase, marked by a sequence of price stages—Selling Climax (SC), Automatic Rally (AR), and Secondary Test (ST). Each stage fits within the price behavior Intel has exhibited since mid-2024. These phases are typically followed by a spring phase and eventual markup if accumulation completes.
The volume bars, aligned beneath the candlestick chart, reflect fluctuating but healthy activity. There are signs of increased buying near the support zone, consistent with institutional accumulation. The chart indicates that Intel may have entered the spring phase, which precedes a potential breakout in Wyckoff methodology.
A breakout from the current range would target $26.20, the top of the defined consolidation box. This price has acted as resistance on multiple occasions over the last 10 months. The falling wedge breakout inside the larger box structure adds further evidence of bullish potential in the near term.
Weekly Trend and Price Behavior Favor a Gradual Recovery
The larger trend shows Intel descending sharply through early 2024, with a notable crash in the summer months. The decline was followed by several months of sideways price action, forming a clear rectangle between support near $19.00 and resistance at $26.20. Such formations often act as basing structures before longer-term reversals.
Candlesticks within the box have displayed both higher lows and tighter consolidation ranges. These changes can signal that sellers are losing control while buyers begin stepping in more aggressively. The wedge breakout just above $21.00 suggests that momentum is slowly shifting in favor of bulls.
Volume analysis supports this view. Rising volume spikes near the lower boundary of the box occurred alongside strong rejections of downside moves. This behavior matches the expected characteristics of a spring phase in Wyckoff accumulation. If sustained, this could bring Intel out of the current range and toward the resistance threshold.
Will Intel Reclaim Its Previous Levels After the Wyckoff Pattern?
The chart raises a key question for investors: will Intel break through $26.20 and reclaim its pre-decline levels?
Technically, the setup aligns with conditions that often lead to rallies, provided the structure holds and volume increases on the breakout. The Wyckoff diagram shown in the image illustrates a similar pattern of accumulation followed by price expansion. Traders are closely observing if Intel can replicate this path.
The 50-week moving average continues to slope downward, suggesting Intel must still prove long-term strength with a decisive move. However, shorter-term signs are building that indicate the stock could shift from a basing phase into the early stages of markup. Price must close and hold above $26.20 for full confirmation.
