- Galaxy Digital moved 39,834 ETH worth $103.6M to Coinbase.
- Ethereum trades at $2,579.60 after breaking out of a descending channel.
- RSI at 74.41 and MACD divergence confirm strong bullish momentum.
Galaxy Digital moved 39,834 Ethereum (ETH), which cost a total of $103.6 million, estimated, to Coinbase in the last 8 hours. The movement is happening amid a minor correction in the wider market for cryptocurrencies, with the attention attracted by the timing and scale of the movement. On-chain data followed the large amount of transactions, marking its occurrence in one batch, mounting pressure to continue the market debate regarding institutional involvement.
Transfer Executed During Broader Market Decline
According to a post by Spot On Chain, the large ETH transfer occurred during a period of declining market prices. Ethereum recently dipped below $2,600, reflecting more general weakness across top assets. Bitcoin also saw a modest decline in the same time frame, with several altcoins following a similar trend. The market’s downturn may have influenced the timing of Galaxy Digital’s deposit.
Galaxy Digital’s ETH movement to Coinbase has raised questions about upcoming market behavior. On-chain analysts recorded the transfer as a single outbound movement from Galaxy Digital’s identified wallet. Coinbase is one of the top exchanges known for institutional inflows, making it a common terminus for sizable transfers.
Galaxy Digital has been known for its exposure to major cryptocurrencies, including Ethereum and Bitcoin. Previous filings and public wallet records show the firm regularly handles large on-chain transactions. Its active involvement in the market includes staking, custody, and liquidity operations.

Ethereum Current Market Action After the Transfer
Based on the data from TradingView, in the daily chart, the Ethereum (ETH) signals strong bullish breakout with some clear signals from both the MACD and RSI indicators. When analysis is carried out, ETH is trading at $2,579.60 showing surge in recent past as it erodes out of a multi-month descending channel.
A closer look at it reveals that Relative Strength Index (RSI) has been set at 74.41 which is above the overbought position of 70. There is a good buying momentum on this level but it indicates that ETH could become resisted or a cooling off process could be underway.
The RSI has spiked from below 50 in late April to over 74 in mid-May, confirming aggressive upward movement.
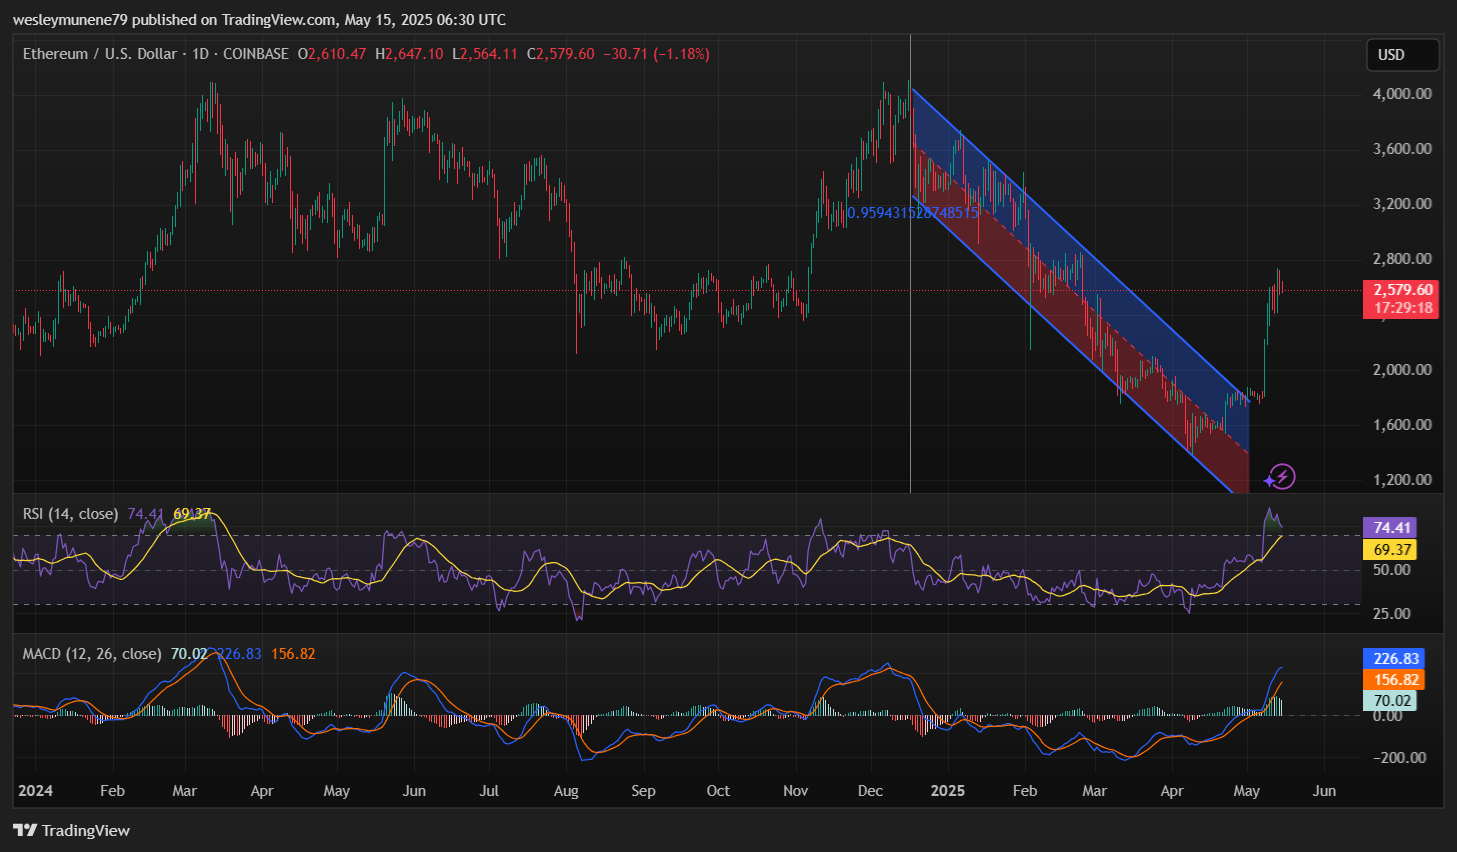
The MACD (12,26,9) offers further confirmation. The MACD line reads 226.83, while the signal line is at 156.82, creating a positive gap of 70.01. This vast divergence is accompanied by a rising histogram, reflecting sustained bullish momentum. The MACD crossover occurred below the zero line in early May, and the indicator has now moved decisively into positive territory.
This momentum aligns with ETH’s price action. After declining near $1,500, Ethereum broke out of the descending channel and quickly rallied past $2,500, gaining over $1,000 in a short span. Suppose ETH can hold above $2,580, a move toward $2,800 remains possible. However, the overbought RSI may trigger a brief pullback or consolidation phase.