- ETH/BTC nears a key trendline with bullish divergence, signaling a possible breakout after a prolonged downtrend.
- A descending broadening wedge and RSI divergence suggest Ethereum may reverse against Bitcoin if resistance is breached.
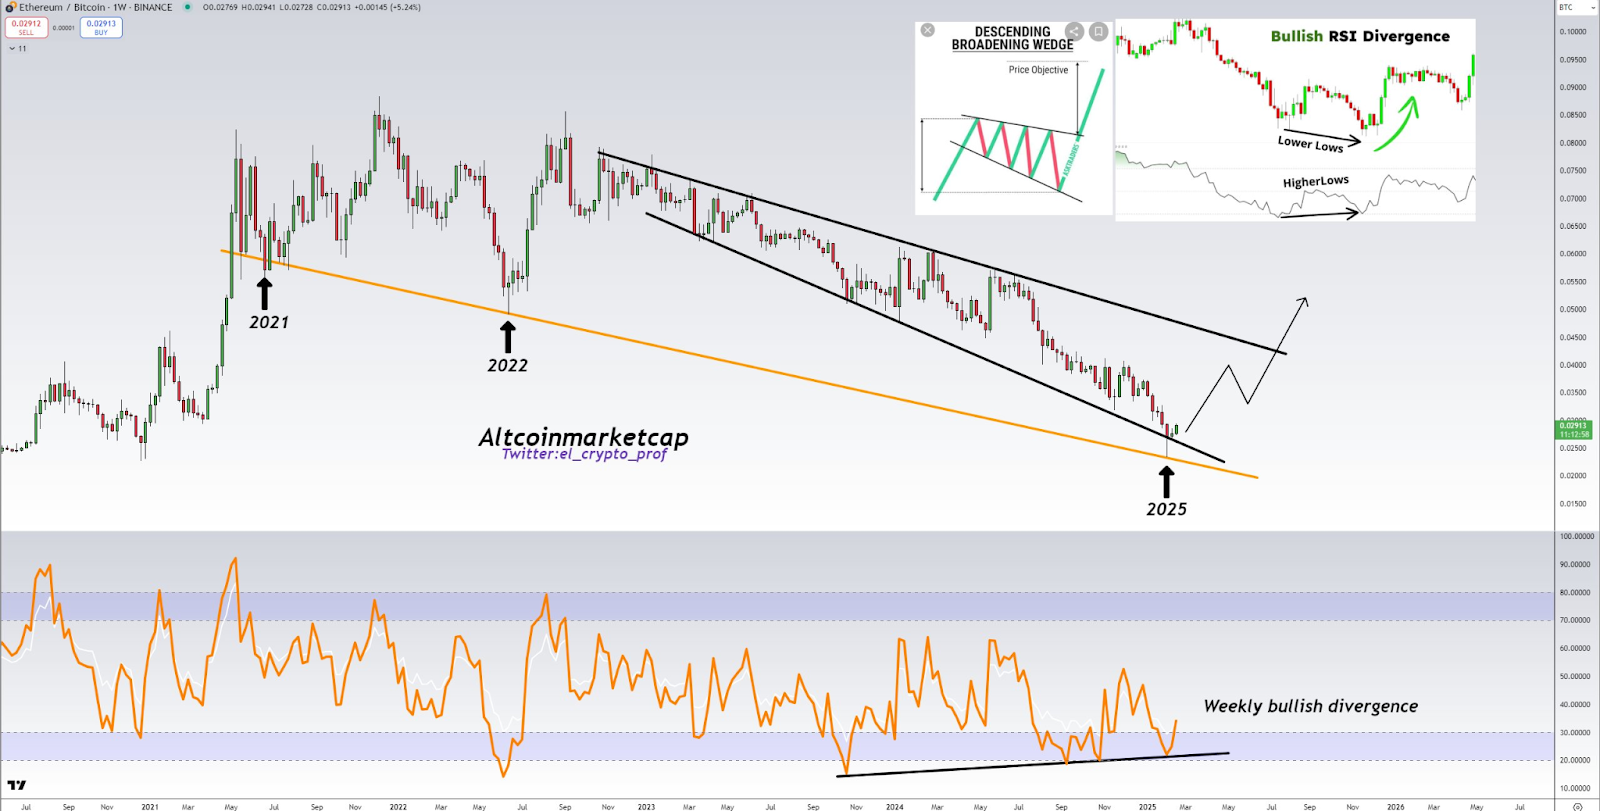
- Tightening volatility hints at an explosive ETH/BTC move, with key targets at 0.035 BTC and 0.045 BTC if momentum builds.
The pair of Ethereum and Bitcoin has shown a potential breakout where bullish technical indicators have offered themselves for a bullish shift. The trend of ETH/BTC for 2.5 years is a descending broadening wedge continuation pattern. Luckily, many bullish conditions now indicate that a possible reverse could take place.
ETH/BTC Chart Highlights Strong Reversal Potential
Moustache recently highlighted a highly bullish structure on the ETH/BTC chart. The pair has formed a long-term descending broadening wedge, touching a four-year downtrend line. Price action remains near the lower boundary of this pattern, historically a strong reversal zone.
Source: Moustache
Besides, the weekly chart reveals a 1.5-year-long bullish divergence on the Relative Strength Index (RSI). As the price continues to make lower lows, this indicator has been creating higher lows. Such a pattern, which signals increasing bullish momentum, frequently comes before trend reversals.
ETH/BTC has repeatedly tested a crucial support trendline that dates back to 2021. This level of support has continuously held, halting more drops. Hence, traders closely monitoring the pair anticipate a potential breakout if resistance levels are breached.
Market Structure Points Toward an Upside Breakout
An eventual breakout is suggested by the descending expanding wedge formation. Before making a clear move, the price action in this pattern veers between convergent trendlines. As we wait for confirmation of a change in market direction, ETH/BTC is still in a range-bound phase.
Moreover, declining volatility within the wedge indicates tightening market conditions. Historical data suggests such patterns often precede explosive price movements. Ethereum breaking above the upper trendline may signal a strong bullish move toward key resistance levels at 0.035 BTC and 0.045 BTC.
