
Key Insights:
- Chainlink trades within a narrowing range as buyers defend support while sellers cap gains, creating a compression pattern that often precedes strong directional price moves.
- Momentum weakens near resistance despite price holding above key averages, indicating reduced bullish strength while technical indicators reflect a balanced and indecisive market structure overall.
- Stabilizing open interest and balanced capital flows signal cautious trader behavior, suggesting a transition phase where accumulation may occur before volatility expansion resumes
Chainlink trades within a narrow band as price action reflects a market waiting for direction. Buyers continue to defend key levels, while sellers maintain control near resistance. Consequently, the asset shows limited movement despite a mildly bullish structure on lower timeframes.
Price remains above key moving averages, which supports a stable medium-term trend. However, momentum near recent highs has weakened, reducing the strength of bullish attempts. Moreover, repeated rejections near resistance indicate that buyers struggle to sustain upward pressure.
Volatility Compression Signals Movement
Tightening price action points to declining volatility across the chart. Additionally, compressed moving averages suggest that a sharp move could follow this period of consolidation. Hence, the current structure reflects a buildup phase rather than a clear trend continuation.
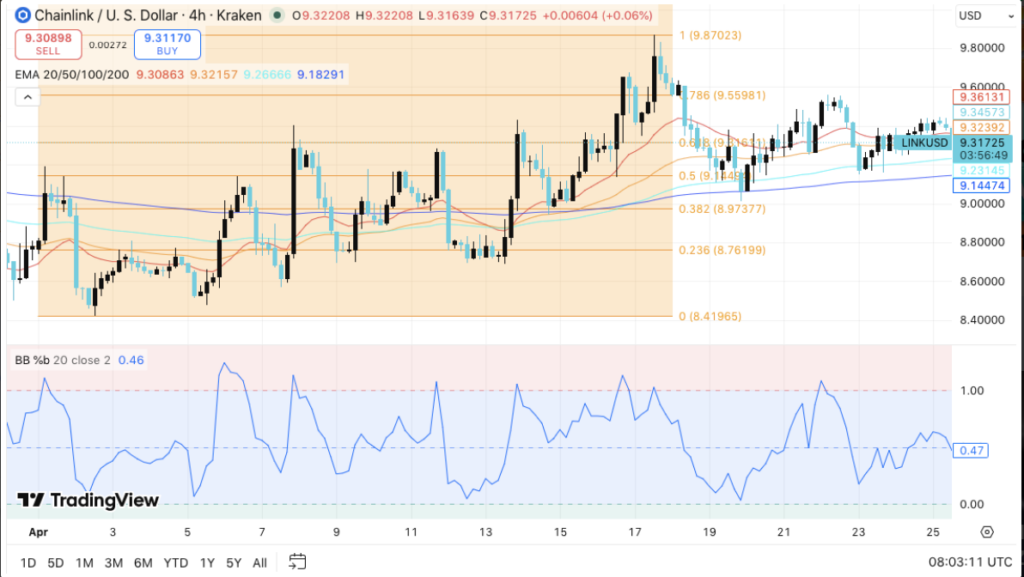
Technical indicators show no strong directional bias as the market remains balanced. Besides, Bollinger positioning reflects stability instead of extreme conditions. Consequently, traders continue to focus on short-term levels while avoiding aggressive positioning.
Support Levels Anchor Price Action
The price holds firm near the lower boundary, where recent rebounds have occurred. Additionally, a key psychological level continues to act as a structural floor for buyers. However, a break below this zone could expose deeper demand areas that previously attracted strong interest.

On the upside, multiple resistance layers continue to cap price movement. Moreover, prior rejection zones reinforce these barriers and slow bullish attempts. Consequently, a decisive move above these levels would likely shift sentiment and encourage stronger buying activity.
Derivatives Data Signals Caution
Open interest trends show fluctuating participation as traders enter and exit positions quickly. Additionally, current levels indicate reduced activity compared to earlier phases. Hence, the derivatives market reflects cautious positioning rather than strong conviction.
Recent flow data indicates that earlier selling pressure has eased over time. Moreover, inflows and outflows now appear more balanced, suggesting a shift toward accumulation. Consequently, the market shows signs of stabilization despite limited momentum.
Key Levels Shape Near-Term Outlook
Immediate resistance zones remain closely watched as they define potential breakout points. Additionally, support levels continue to anchor price movement and prevent deeper declines. Hence, these boundaries guide short-term trading decisions across the market.
The current setup reflects a compression phase with rising pressure on both sides. Moreover, higher lows combined with capped highs signal a tightening range. Consequently, the market appears positioned for a sharp move once direction becomes clear.
