Celestia is a blockchain network that offers a modular approach to consensus and data availability. This architecture allows developers to deploy decentralized applications (dApps) and blockchain ecosystems without the complexities of building these components from scratch. The native token of Celestia is TIA, which plays a crucial role in the network’s operations, including transaction fees and staking mechanisms.
ERC-20 Standard and TIA
The TIA token of Celestia is based on the Ethereum ERC-20 standard, which is a common framework for creating tokens on the Ethereum blockchain. This standard ensures compatibility with various Ethereum-based services and wallets, making TIA easily transferable and usable within the Ethereum ecosystem. Using the ERC-20 standard also facilitates the integration of TIA into decentralized exchanges (DEXs) and other financial instruments.
Benefits of a Modular Blockchain
Celestia’s modular framework divides the traditional blockchain architecture into separate layers for consensus, data availability, and execution. This separation allows for more flexibility and scalability than typical blockchains. For instance, developers can choose different execution environments based on their needs without modifying the underlying consensus layer. This modularity significantly reduces the barriers to entry for creating and managing new blockchain networks, encouraging innovation and diversity in the blockchain space.
Celestia (TIA) Technical Analysis
The monthly chart for Celestia TIA displays a remarkable surge in its price, closing the period at $11.47 after starting significantly lower, marking a 17.47% increase over the month. Celestia began the month at around $9.76 and encountered several fluctuations, dipping below $9.50 at its lowest. However, a strong upward trend emerged toward the month’s end, with the price rapidly climbing to its peak above $11.50.
This substantial price increase correlates with a rise in trading volume, which saw an impressive 234.73% jump, suggesting heightened investor interest and trading activity. The volume/market cap ratio also peaked at an exceptional 18.20%, indicating a very active market compared to its overall valuation.
Given the current momentum and the trading patterns observed, Celestia TIA’s market outlook appears robust, with the potential for continued upward movement. However, monitoring the support level around $11.00 will be crucial, as any significant breaks below this could suggest a shift in market sentiment, potentially leading to a retest of lower price levels.
 Celestia (TIA) 1-Month Price Chart (Source: CoinMarketCap)
Celestia TIA’s last seven-day price chart shows a compelling upward trajectory, beginning the week around $9.67 and concluding near the high at $11.50. Initially, the token faced some stability as it lingered just below $10.00, marked by slight fluctuations that didn’t venture far from the baseline.
As the week progressed, a significant rally pushed the price above the $ 10.00 mark, which might have triggered increased buying activity. The steep rise that followed suggests a breakout, with the price quickly moving past $10.50 and reaching up towards $11.50. This movement shows strong buying pressure and investor confidence, possibly spurred by positive market news.

Celestia (TIA) 7-day Price Chart (Source: CoinMarketCap)
Celestia Price Analysis: Relative Strength Index (RSI)
The 4-hour chart for Celestia TIA shows significant upward movement with the price reaching a high of $11.54 before experiencing a slight retracement to around $11.43. This pattern suggests a bullish trend with investors showing strong buying interest during this period.
The Relative Strength Index (RSI) is at 65.92, near the upper threshold of 70 which typically signals overbought conditions. However, remaining below 70 suggests that while the market is approaching overbought territory, there might still be some room for upward movement before selling pressure kicks in.
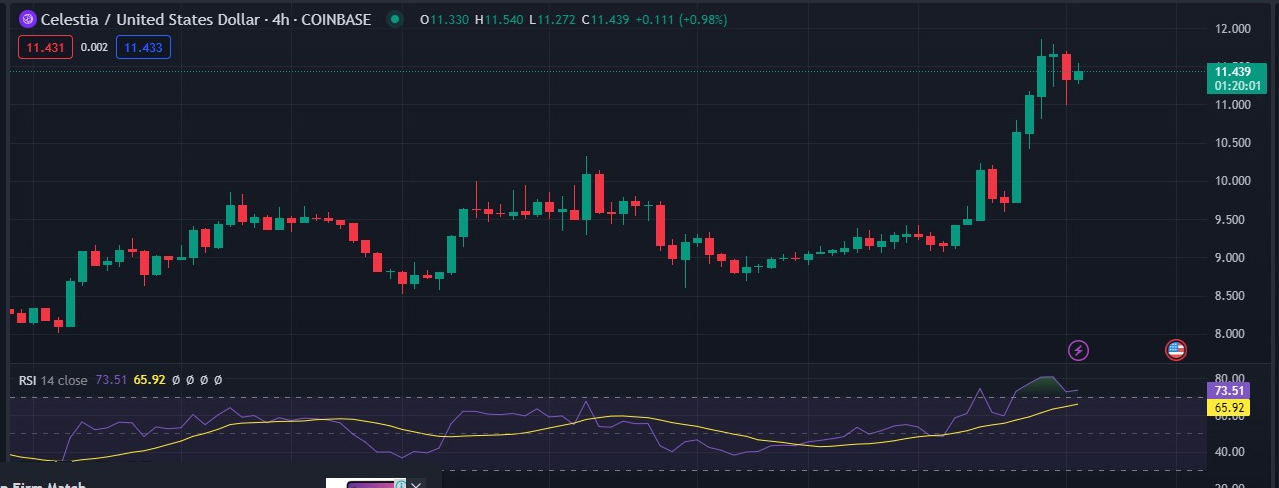
TIA/USD 4-Hour Price Chart (source: Trading View)
Celestia Price Analysis: Moving Average Convergence Divergence (MACD)
Additionally, the Moving Average Convergence Divergence (MACD) indicator supports the market’s bullish sentiment. The MACD line at 0.591 is above the signal line at 0.372, indicating a strong buy signal. The histogram, reflecting the difference between the MACD line and the signal line, has also been increasing, further confirming the strength of the current uptrend.
This period has been characterized by a gradual and sustained increase in price, signalling strong buying interest. The positive divergence between the MACD and its signal line since around the $10 mark suggests that the upward momentum could continue if the buying pressure persists.
Given the current figures and the trend’s direction, the near-term outlook for Celestia appears positive with potential resistance near the recent high of $11.54. However, traders should watch for any potential crossover of the MACD line beneath the signal line as this could indicate a possible pullback or consolidation phase.

TIA/USD 4-Hour Price Chart (source: Trading View)
Celestia Price Analysis: Chaikin Money Flow (CMF)
The Chaikin Money Flow (CMF) indicator, which assesses the amount of money flowing into or out of an asset, supports this bullish sentiment. Currently, the CMF is positive at 0.38, suggesting that buying pressure outweighs selling pressure, as more money is entering the market than exiting. A positive CMF value typically indicates strong market strength and can validate the uptrend seen in the price chart.
Given the positive CMF and the recent price rise, Celestia is in a strong position. If the CMF remains positive and the price sustains above the recent support level of around $11.00, further gains could be expected. However, traders should monitor the CMF for any signs of decline, which could indicate a shift in money flow and potential price corrections.
 TIA/USD 4-Hour Price Chart (source: Trading View)
Celestia (TIA) Price Prediction:
| Price Prediction | Potential Low ($) | Average Price ($) | Potential High ($) |
| 2024 | $10.59 | $13.11 | $19.33 |
| 2025 | $13.71 | $16.14 | $20.56 |
| 2026 | $17.82 | $22.28 | $26.73 |
| 2027 | $23.17 | $28.96 | $34.75 |
| 2028 | $30.12 | $37.65 | $45.18 |
| 2029 | $39.15 | $48.94 | $58.73 |
| 2030 | $50.90 | $63.62 | $76.35 |
| 2031 | $66.17 | $82.71 | $99.25 |
| 2032 | $86.02 | $105.52 | $129.03 |
| 2035 | $188.98 | $230.23 | $283.48 |
Celestia (TIA) Price Prediction 2024
In 2024, Celestia is projected to achieve a minimum price level of $10.59. The price has the potential to escalate up to a maximum of $19.33 while maintaining an average trading price of around $13.11 throughout the year.
Celestia (TIA) Price Prediction 2025
Detailed technical analysis of historical Celestia price movements suggests that in 2025, Celestia’s price is anticipated to achieve a minimum of $13.71. The price might escalate to a maximum of $20.56 while maintaining an average trading price of approximately $16.14 throughout the year.
Celestia (TIA) Price Prediction 2026
For 2026, Celestia is forecasted to have a minimum price of $17.82. It could reach a maximum of $26.73, with an anticipated average trading price of $22.28 throughout the year.
Celestia (TIA) Price Prediction 2027
Analysis indicates that the lowest price of Celestia in 2027 could be $23.17. The price may rise to a maximum of $34.75, with an average expected value of $28.96 throughout the year.
Celestia (TIA) Price Prediction 2028
For 2028, Celestia’s projected minimum price is expected to be $30.12. The maximum price could reach $45.18, with an average trading price of $37.65.
Celestia (TIA) Price Prediction 2029
In 2029, Celestia’s price is anticipated to have a minimum value of $39.15. It could rise to a maximum of $58.73, with an average trading price expected to be around $48.94 throughout the year.
Celestia (TIA) Price Prediction 2030
Forecast data suggests that in 2030, Celestia’s price could see a low of around $50.90. The highest potential price is projected to be $76.35, with an average expected trading price of $63.62 throughout the year.
Celestia (TIA) Price Prediction 2031
Technical analysis indicates that in 2031, Celestia’s price is expected to start at a minimum of $66.17. It could rise to $99.25, with the average annual trading price likely around $82.71.
Celestia (TIA) Price Prediction 2032
Detailed technical analysis of historical price data for Celestia indicates that in 2032, the price is expected to reach a minimum of $86.02. The maximum price could climb to $129.03, with an average trading price of $105.52 throughout the year.
Celestia (TIA) Price Prediction 2033
Based on the forecast and technical analysis, Celestia’s price in 2035 is projected to have a minimum value of $188.98. It could potentially reach a maximum of $283.48, with the average price expected to be around $230.23 for the year.
FAQs
What is Celestia (TIA)?
Celestia stands as an innovative cryptocurrency venture, concentrating on constructing a modular consensus and data availability layer.
Where can you purchase Celestia (TIA)?
Traders can trade Celestia (TIA) on cryptocurrency exchanges such as Binance, Bybit, OKX, DigiFinex, and BingX.
Will Celestia (TIA) reach a new ATH soon?
With the ongoing developments and upgrades within the Celestia platform, Celestia (TIA) is highly likely to reach its ATH soon.
What is the current all-time high (ATH) of Celestia (TIA)?
Celestia (TIA) hit its current all-time high (ATH) of $20.91 on February 10, 2024.
What is the lowest price of Celestia (TIA)?
According to CoinMarketCap, TIA hit its all-time low (ATL) of $2.03 on October 31, 2023.
Is Celestia a good investment?
Celestia has a good potential ROI as its volatility offers opportunities for many profits. Such volatility is a double-edged sword, but it would suit investors with a high-risk tolerance and a healthy financial position.
What is the highest price Celestia can hit in 2025?
Celestia could be worth $20.56 in 2025 as analysed and forecasted.
What is the best-forecasted price Celestia can rally to in 2030?
According to our analysis, It is possible that Celestia can rally to $76.35 by 2030.
Disclaimer: The views and opinions in this article belong to the writer alone and they do not necessarily reflect the position of CryptoNewsLand (CNL). No information in this article, whether expressed or implied, should be taken as financial advice. Remember that investing in cryptocurrency poses significant risks to your asset. Hence, CNL strongly recommends all readers perform their own in-depth research before investing in cryptocurrency.