
- Cardano breaks key resistance, fueling expectations of a rally toward $0.90–$2.90 levels.
- ADA’s breakout triggers momentum with strong volume and RSI, indicating bullish sentiment.
- Volume patterns support potential long-term growth with price targets reaching $2.90.
Cardano (ADA) has broken a key descending trendline, fueling speculation of a broader crypto market rally. Analysts are now watching the $0.90 and $2.90 levels as the next major price targets.
Cardano’s Breakout Marks Key Technical Shift
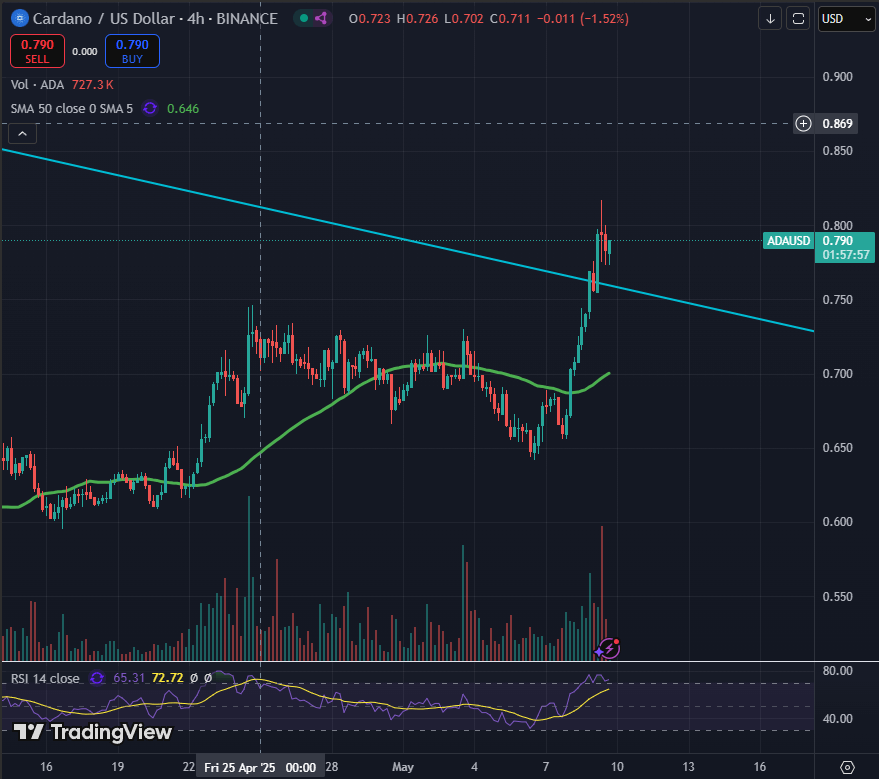
ADA’s recent breakout on the 4-hour Binance chart reveals bullish momentum building across key indicators and price structures. Volume spikes, RSI strength, and a breached resistance line suggest a strong shift in sentiment. This move comes as ADA trades at $0.790, with a 1.52% decline in the last 4-hour candle.
Source: Sssebi
As we can see from the post above, one bullish analyst, Ssebi, has identified a critical breakout in ADA. According to Ssebi, ADA has successfully breached a long-standing descending resistance near $0.750. He notes that this occurred after several failed tests from mid-April through early May.
Ssebi has provided insights into volume, price levels, and technical support zones, confirming a bullish trend. The analyst reports that the 50-period SMA stands at $0.646, with ADA now trading well above that line. Trading volume reached 727.3K during the breakout, reflecting heightened market activity.
RSI readings show a steady build in momentum, moving from 65.31 to an overbought 72.72. This shift reflects strong accumulation pressure and confirms bullish behavior. According to Ssebi, previous consolidation between $0.660 and $0.700 has now transitioned into higher lows and strong candles.

The trendline that held since early April now acts as a potential support area. Ssebi’s analysis points to a target near $0.90 for the next leg, aligning with ADA’s momentum. On top of that, there’s the fact that price movement and volume suggest market participants are positioning for a continuation.
Javon Marks Projects Long-Term Upside Potential
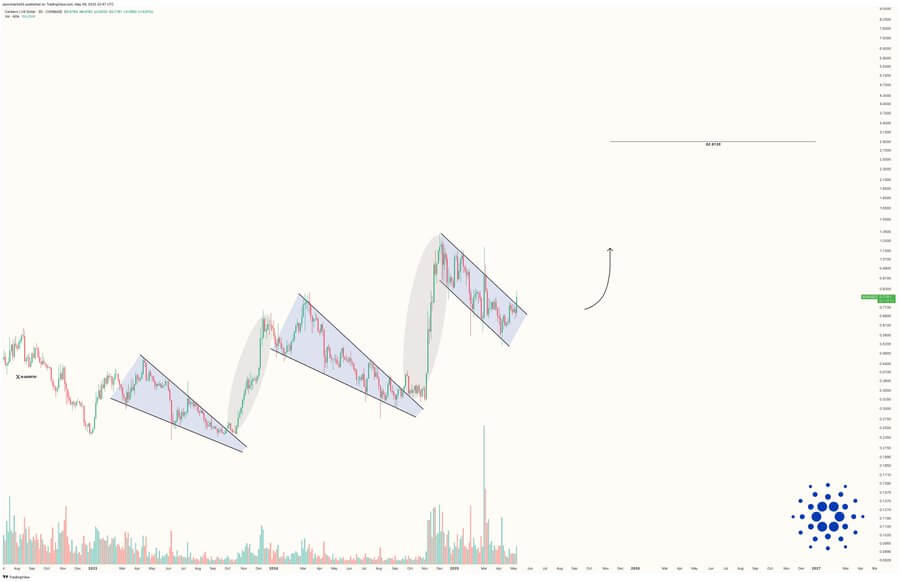
Another important point to keep in mind is that a prominent market analystJavon Marks, offers a broader perspective using macro chart patterns. His analysis covers ADA’s multi-phase consolidation, showing symmetrical triangles followed by steep rallies. Javon Marks identifies fractal behavior in price action, recurring over multiple time frames.
Source: Javon Marks
According to Marks, the latest downward channel mirrors prior consolidation patterns that led to major breakout runs. He has presented a detailed analysis indicating ADA could rally toward the $2.70 to $2.90 range. That projection reflects a 243% increase from current levels.
Not only that, but there’s also structural confirmation with volume expansions at each breakout point. If we take it a step further, Marks sees the fractal model supporting sustained bullish cycles through 2026. The horizontal level at $2.933 acts as a key long-term price target in his model.
