
- Cardano mimics its 2020 cycle, with recent corrections signaling a potential rally to reclaim previous highs.
- $ADA’s history shows consolidation phases followed by explosive growth, with current conditions hinting at a bullish reversal.
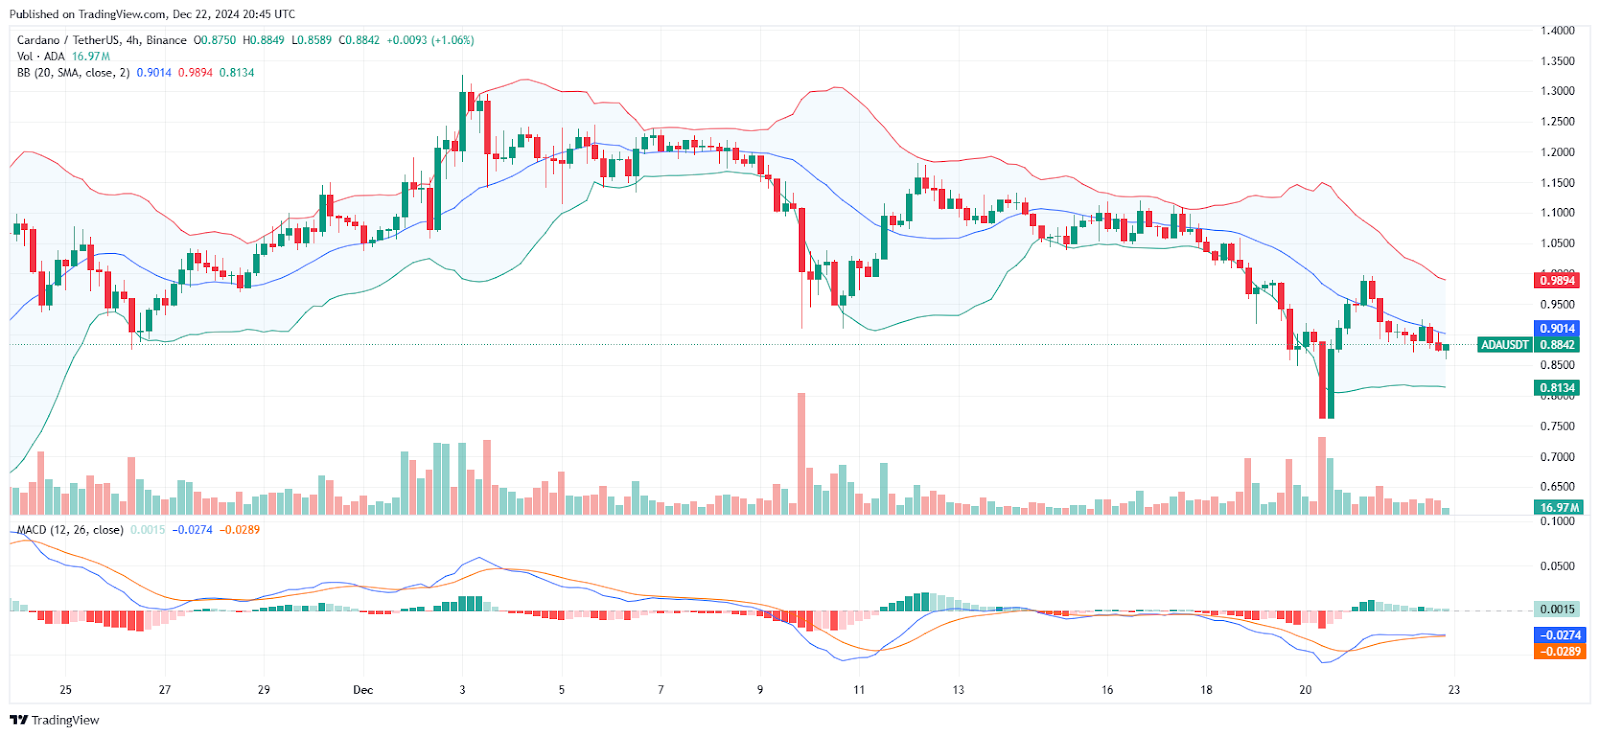
- Testing $0.850 support and $0.901 resistance, Cardano’s narrowing MACD histogram signals a possible momentum shift.
Cardano ($ADA) is following a similar pattern to its previous cycle from 2020. A major correction has occurred after a bull rally, mimicking the trend that played out during the same period three years ago. ADA’s current behavior could signal a return to previous highs. Some experts even predict a potential surge to $6, driven by similar market conditions.
A History of Consolidation and Growth
Crypto analyst Ali reveals key insights into Cardano’s long-term price movements. Initially, ADA consolidated for 96 weeks between 2020 and 2022. This range-bound period saw minimal price change, accompanied by a low volume of trading activity. However, the market experienced a sharp drop of 56.20% during the COVID-19 crash, marking the beginning of the recovery phase.
Following this downturn, ADA witnessed a massive surge starting in November 2020. Over the next 10 months, ADA increased by 4,095.73%, peaking at $3.085 in August 2021. However, even during this bullish phase, ADA experienced a 33.85% pullback. The price correction lasted for about five months, yet the uptrend continued, supported by growing trading volume.
Current Market Conditions: A Pullback and Stabilization
In mid-2023, ADA entered another consolidation phase. The market’s price movements slowed down, with little volatility over a 65-week period. Despite the subdued price action, ADA remained within a narrow range. The recent price surge in 2024 has sparked renewed interest, though a correction followed soon after.
As of December 2024, ADA has tested its upper Bollinger Band, which suggests an overbought condition. Following this, the price experienced a downward trend, stabilizing near the lower band. The price action indicates a potential attempt to reclaim the midline at $0.901. Currently, ADA is testing support at around $0.850, with resistance at $0.901.
Source: CryptoRank
Volume analysis confirms market activity, especially during sharp price movements. The MACD indicator has shown bearish momentum in recent weeks, though its narrowing histogram suggests the downtrend may lose strength soon.
