
- XRP’s RSI signals strong upward momentum, with prices likely hitting $4–$5 before a correction expected in March 2025.
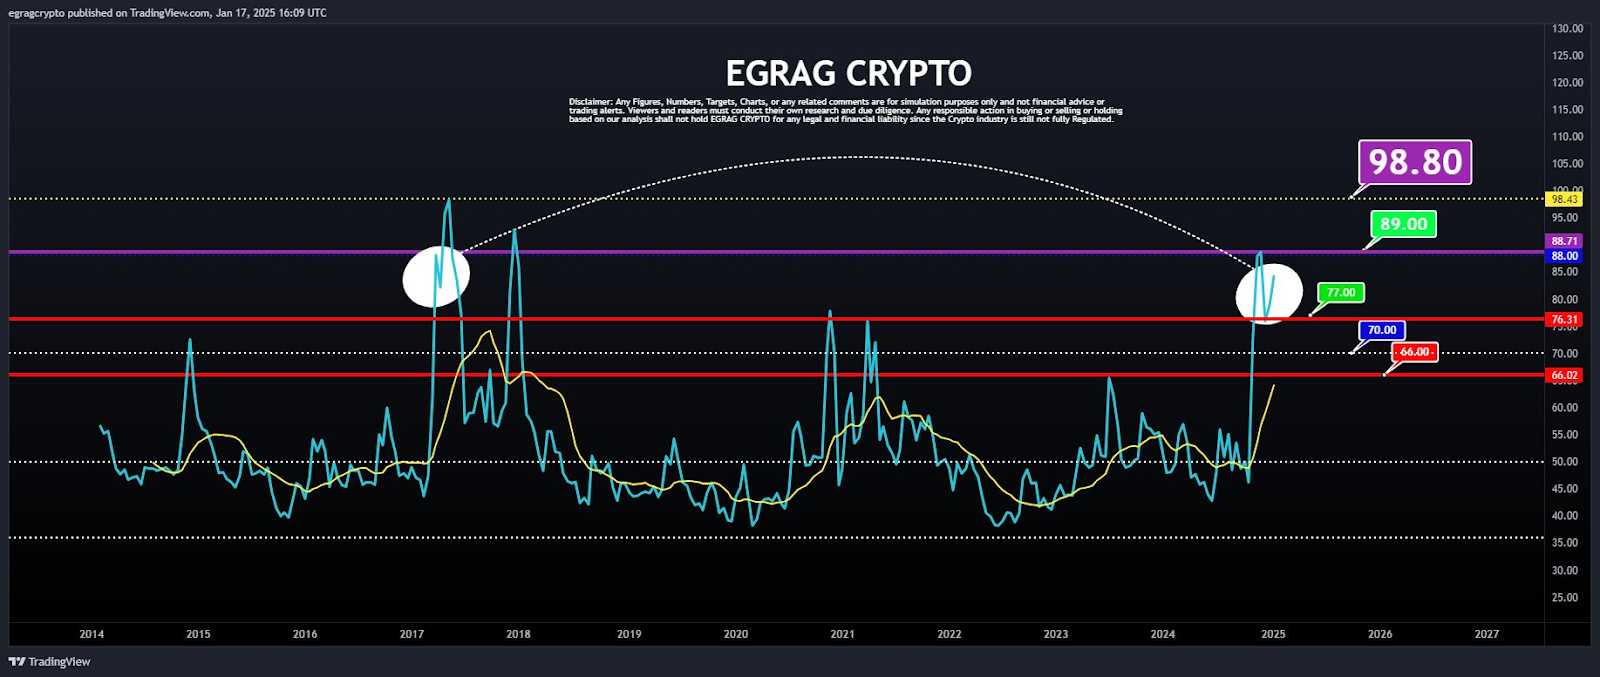
- Key support ($66.02, $76.31) and resistance levels ($88.00, $98.80) guide XRP’s price action, reflecting market cycles and growth.
- Historical symmetry in XRP price trends hints at predictable cycles, helping investors plan around the projected 2025 peak.
According to crypto analyst EGRAG Crypto, XRP’s Relative Strength Index (RSI) has reversed in the two-week timeframe, signaling more room for upward movement. The price could reach between $4 and $5 before a potential correction in March 2025. This aligns with the market’s cyclical behavior, where euphoria often precedes major pullbacks.
Key Price Levels and RSI Insights
EGRAG Crypto’s analysis emphasizes the importance of understanding XRP’s historical price trends and projected levels. Key resistance zones at $88.00, $89.00, and $98.80 could challenge the market during the anticipated 2025 peak. Meanwhile, critical support levels at $66.02 and $76.31 may stabilize any potential downturns.
Source: Egrag Crypto
The RSI remains a vital mid-term indicator, showing strong momentum for continued price growth. Besides, historical data aligns with a pattern of symmetrical price movements. This reinforces confidence in a projected peak in 2025, mirroring the 2017 highs.

March 2025: Correction and Bullish Continuation
As XRP heads toward the $4 to $5 range, market participants are advised to remain cautious. EGRAG Crypto predicts a heavy correction in March 2025, which could reset market dynamics. However, the long-term outlook remains bullish, with the bull run expected to resume post-correction.
The long-term yellow moving average reflects consistent upward momentum, aligning with key levels of importance. Additionally, intermediate markers like $70.00 and $77.00 provide further insight into potential consolidation zones. This suggests a balanced outlook with opportunities for strategic entry points.
Symmetry in Price Movements
Historical data highlights symmetrical behavior, suggesting XRP prices move in predictable cycles. This symmetry is evident in the dotted arc connecting the 2017 and projected 2025 peaks. Consequently, investors can leverage these patterns for informed decision-making.
Moreover, the chart underscores the interplay between price consolidation and volatility. Consolidation phases near mid-range levels often indicate market indecision before sharp directional movements.
