- Bitcoin shows a double zigzag structure, targeting the 61.8%-78.6% Fibonacci retracement levels.
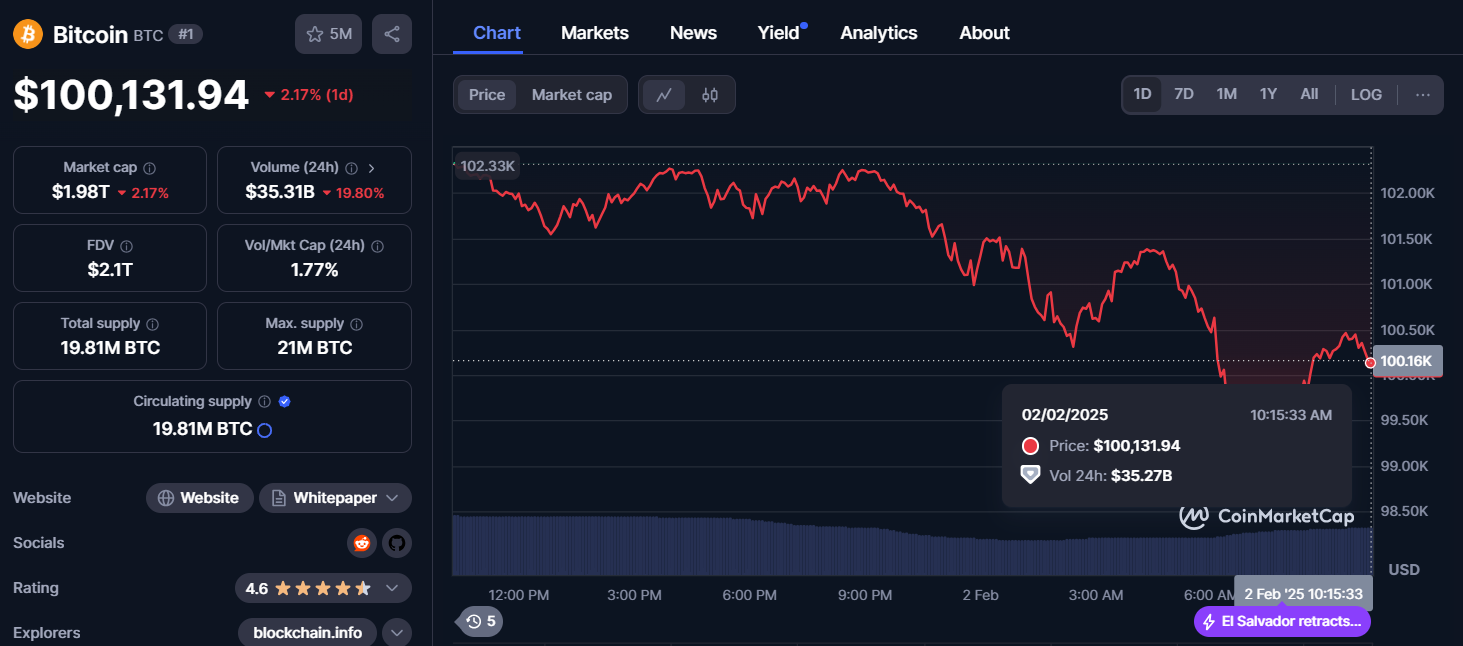
- Bitcoin’s price dropped 2.17% in a day, with a $1.98T market cap and $35.31B 24-hour volume.
- Traders monitor the golden Fibonacci zone for support, while a breakdown risks further bearish movement.
Bitcoin remains within its corrective channel, maintaining a structured pattern on a shorter timeframe. Analysts are monitoring support levels, particularly around the golden Fibonacci zone, as price action continues to respect this formation.
Key Support and Fibonacci Alignment
According to an observation done by XForceGlobal, Bitcoin is forming a corrective pattern within a double zigzag structure. A central termination point for Macro Wave 3 is indicated, with a potential retracement in Macro Wave 4 targeting the 61.8% to 78.6% Fibonacci levels.
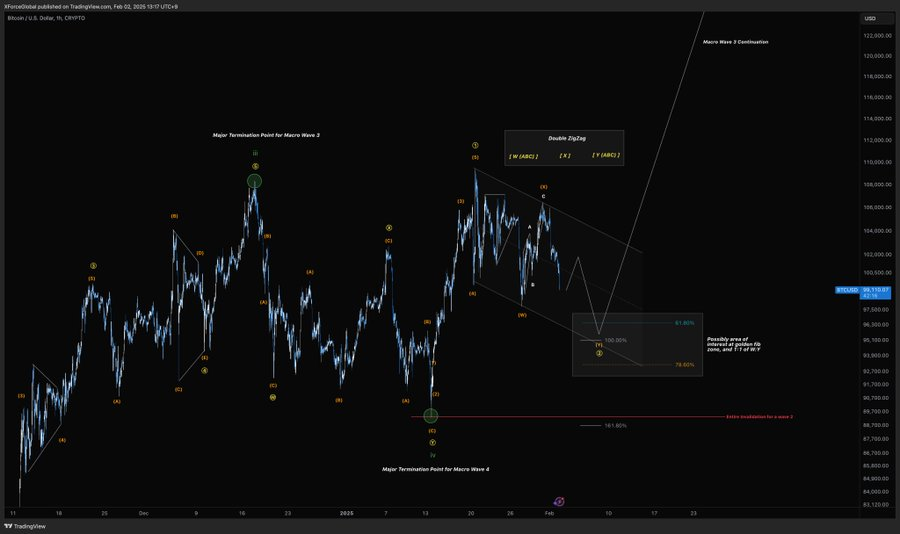
The price action aligns with a corrective channel, suggesting consolidation before a continuation in Macro Wave 5 toward higher levels. The golden Fibonacci zone aligns with critical technical levels, providing a potential area for Bitcoin to find support.
Additionally, the 1:1 ratio of the W:Y corrective wave structure matches within this range, reinforcing the significance of this level in the current market structure. Traders are observing these points to assess potential reversals or further downside movement.
While Bitcoin maintains its position within the corrective channel, a breakdown below the established red line would indicate increased bearish momentum. If price action breaches this threshold, market sentiment may shift, leading to further valuation declines.
Market Insights and Next Steps
According to recent updates, CoinMarketCap data indicates that Bitcoin is trading at $100,131.94, reflecting a 2.17% drop within a day. The market cap stands at $1.98 trillion, with a 24-hour trading volume of $35.31 billion, marking a 19.80% decline.
The ongoing price behavior suggests that Bitcoin’s trajectory will depend on whether support holds within the golden Fibonacci zone. A rebound from this level could indicate a continuation of consolidation or a potential upward move. Conversely, a breakdown beyond the red line could introduce additional selling pressure, affecting broader market dynamics.