
- Historical EMA-based patterns and cycle extensions suggest a potential BTC peak around $175,000 this bull run.
- Applying past percentage gains from EMA breakouts (60%, 170%, 75%) yields an average 101% upside—fueling the $175K projection.
- Using similar cycle-based methods, XRP’s conservative price target is set at $27, with a maximum estimate of $33 based on prior peaks.
Bitcoin is currently trading at $110,470, recording a 3.8% increase over the last 24 hours. With support holding at $106,185 and resistance forming near $111,544, price action continues to tighten. This move comes as historical comparisons resurface, suggesting a potential cycle top near $175,000. Recent analysis has drawn attention to repeatable market behaviors and technical signals that support this outlook.
Cycle Extension Points to $175K Target
According to analyst Egragcrypto, he draws comparison from the 2017–2018 bull cycle, where Bitcoin peaked near $20,000. Applying a tenfold extension from that cycle suggests a possible top around $200,000 in the current phase. However, revised estimates place the target closer to $175,000 based on technical averages.
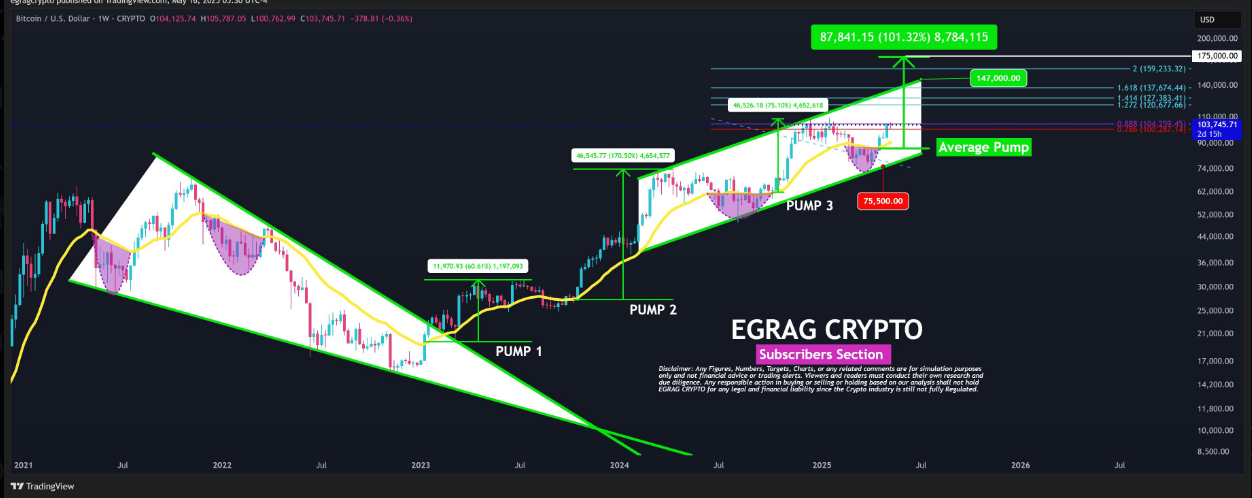
In particular, historical price movements following a close above the 21-week exponential moving average (EMA) have produced significant gains. Three separate instances showed increases of 60%, 170%, and 75%. The average of these moves, calculated at 101%, is being applied to the most recent breakout, placing the projected peak in the $175,000 range. This method relies purely on historical data, without speculative assumptions.
Similar Methodology Applied to XRP
The same extension principle has been applied to XRP’s performance. During the 2017 market cycle, XRP reached a peak of $3.30. A 10X move from that level would place XRP around $33. A more conservative figure of $27 has been cited based on adjusted expectations and broader market considerations.

This approach suggests that multiple large-cap cryptocurrencies may be tracing similar cycle-based patterns. The use of prior market tops as reference points is common among chart analysts when trying to forecast long-term resistance zones.
Historical Data Strengthens Technical Outlook
The average gains seen after weekly closes above the 21-week EMA continue to inform many forward-looking models. Repeated outcomes from past cycles provide a statistical foundation for the current projections.
With Bitcoin’s current momentum and historical behavior aligned, this model gains attention for its clear structure and data-backed reasoning. The numbers reflect patterns rather than predictions, offering a practical framework for observing price movement during this stage of the cycle.
