
- Bitcoin’s MACD shows a significant cross-over on the monthly chart.
- This technical signal is often viewed as a bullish indicator.
- Speculations rise about the end of the current bear market.
As Bitcoin enthusiasts closely monitor the cryptocurrency’s movements, a notable development has emerged. The Moving Average Convergence Divergence (MACD), a vital technical indicator, has displayed a widening cross-over on Bitcoin’s monthly chart. For many, this is a sign of renewed hope and a potential shift in market dynamics.
The MACD, used by traders to identify changes in an asset’s momentum, serves as a reliable indicator of potential market shifts. A cross-over, particularly one that’s widening, often hints at an emerging bullish trend. In the case of Bitcoin, this could signify the possible culmination of the bearish phase that has dominated recent months.
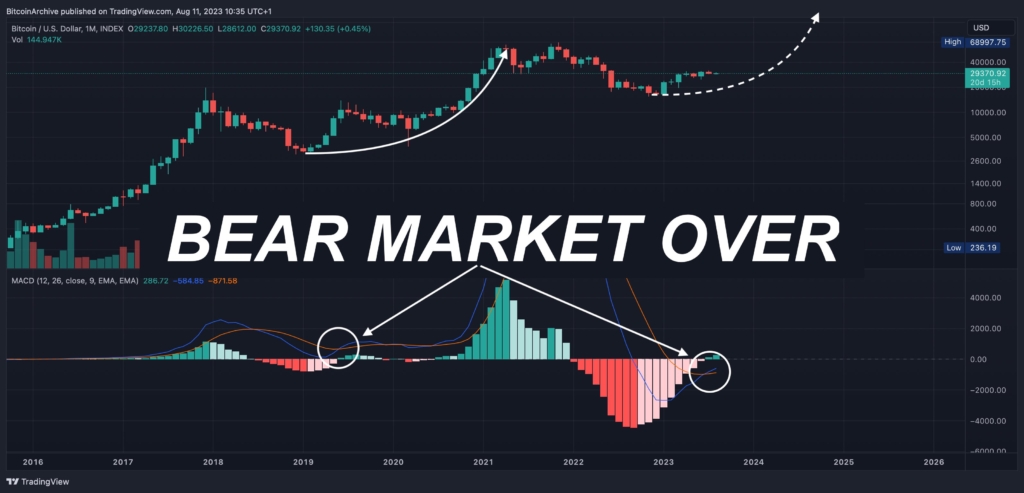
Source : Bitcoin Archive
While it’s essential to approach such indicators with caution, the crypto community is abuzz with optimism. The potential end of the bear market, as suggested by the MACD’s current behavior, would be a welcome relief for many investors who have weathered the storm of price dips and market uncertainty.

However, as always, the crypto landscape is unpredictable. While technical indicators like the MACD provide valuable insights, they are just one piece of the complex puzzle that is cryptocurrency trading. Investors should continue to stay informed, monitor other indicators, and perhaps most importantly, keep their investment strategies flexible in response to the ever-evolving market scenarios.