
- The coin faces obstacles at $64K as instability continues.
- Fibonacci levels suggest a potential consolidation phase.
- The RSI and MACD indicate mixed market momentum ahead.
Bitcoin is currently trading at close by $64,002.12, having a slight increase of 0.04% over the past 24 hours, as per the data from CoinMarketCap. The crypto market cap stands at $1.26 trillion, which maintains its position as the dominant player in the market. With a previous trading volume of $21.31 B, the coin has seen a 6.89% rise in trading activity, which has led to a volume/market cap ratio of 1.68%.
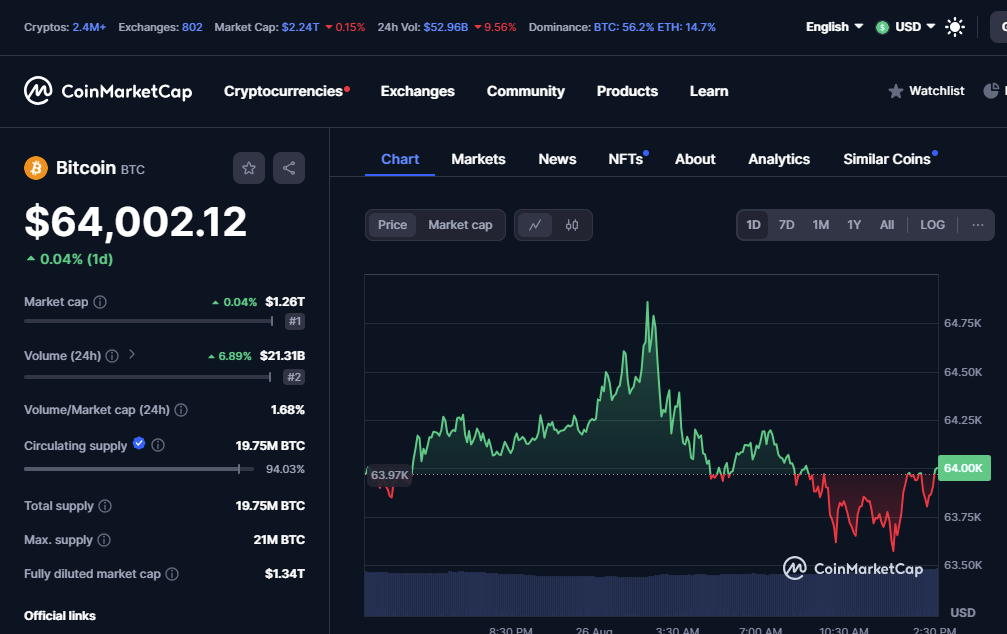
Source: coinmarketcap
The circulating supply of the token is at 19.75 million BTC, that represents 94.03% of its total supply cap of 21 million BTC. The fully diluted market cap, which considers the maximum availability, is projected at $1.34 trillion.
The token has a peak of around $64,750 before dipping slightly with the present shift in the economy. Analysts continue to monitor these price movements closely, with many assessing the potential for either a withdrawal above resistance levels or a possible retracement.
Bitcoin’s dominance in the crypto space remains strong, currently standing at 56.2%, while ETH holds 14.7% of the economic share. The broader market has also seen a s dip, with the total market cap decreasing by 0.15% to $2.24T. The intraday volume across all crypto is reported at $52.96 B, marking a 9.56% decline.
Bitcoin Price Action
BTC is participating in a challenging period as it lingers around $63,883, reflecting a slight decline of 0.57% over the past day, according to the latest TradingView data. The coin continues to exhibit Instability, with BTC facing resistance near the $64,000 level.
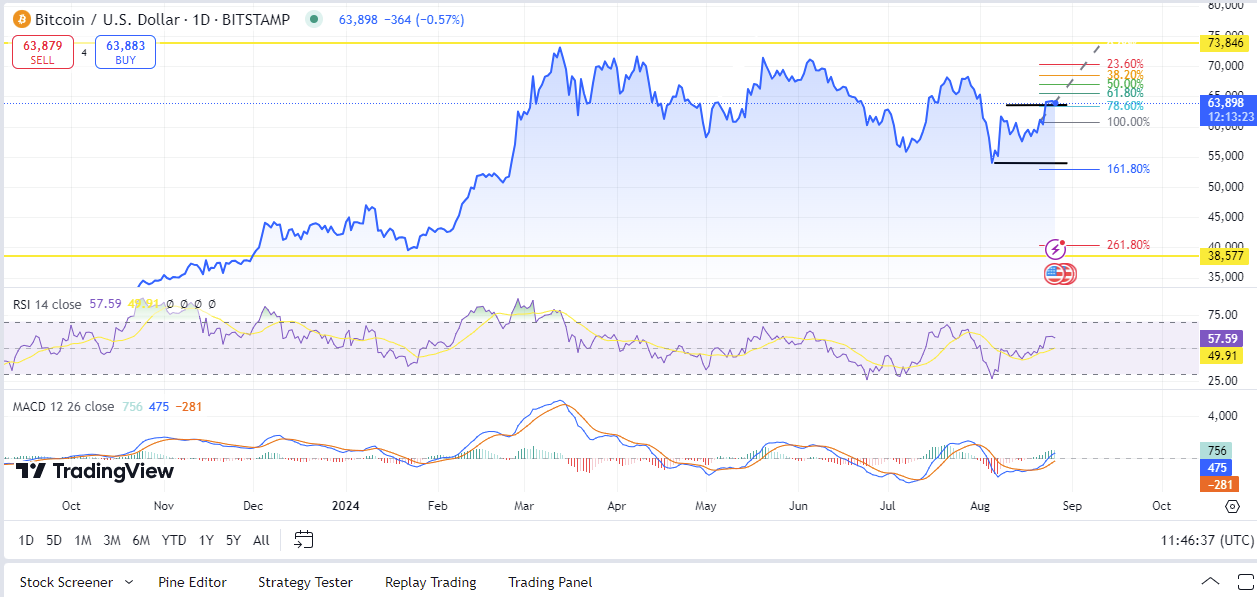
Source: Tradingview
The price intervention shows that Bitcoin attempted to break through critical resistance levels but faced rejection, which has led to some retracement. The key Fibonacci levels of 23.6%, 38.2%, 50.0%, and 61.8% are evident on the chart, providing crucial support and resistance zones. The price is currently trading between the 78.6% and 100% retracement levels, implying that an integration phase might be underway.
The Relative Strength Index is at 57.59, indicating that Bitcoin is in neutral territory. The indicator has seen a gradual increase from its previous low of 49.91, signalling a shift towards bullish momentum. However, the RSI has not yet crossed into overbought territory, leaving room for further price action in either direction.
The Moving Average Convergence Divergence indicator shows a recent bullish overlap, with the its line (756) crossing above the signal line (475). This could result in a likely change in the coin’s trajectory in the future.
