
- Bitcoin drops to $58,774 with a 4.10% decrease in 24 hours.
- Trading volume rises by 87.12% suggesting high investor activity.
- Technical analysis hints at a potential shift as the coin hovers near key support levels.
BTC charges have seen a notable price reduction in the past 24 hours, falling to $58,774, which is representing a 4.10% drop. This decrease is also seen in market capitalization, which has reduced by 4.16% within the last 24 hours, approximating to $1.16 trillion. The outcomes place Bitcoin as the top cryptocurrency globally by market cap. Despite this diminution, trading volume has seen a trend contradiction as it had an increase of 87.12%, reaching over $27.46 billion in the past day. This in turn suggests increased activity by the investors in the market.
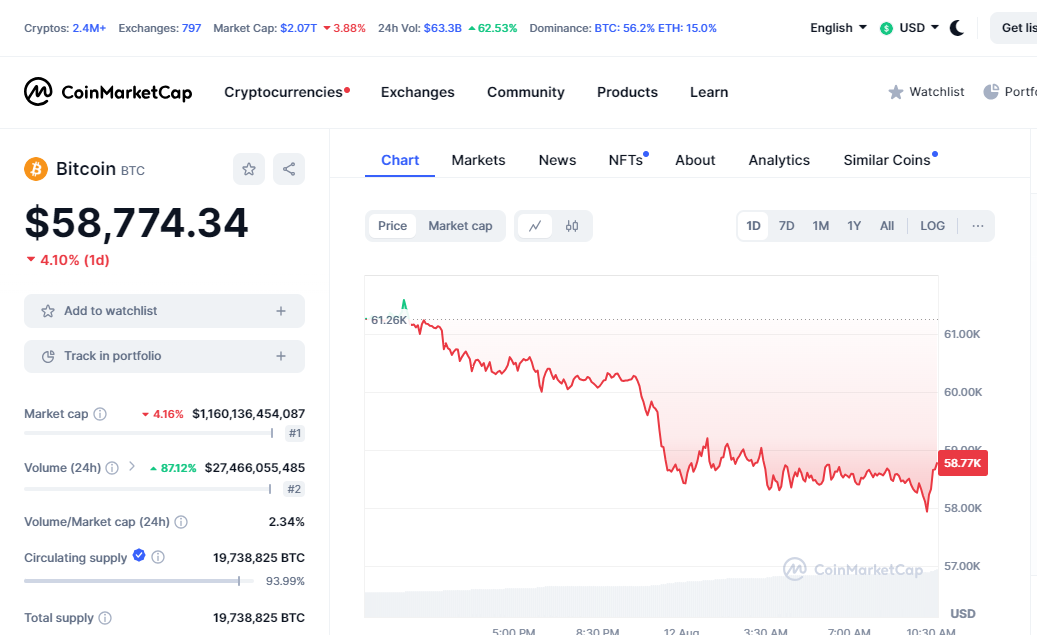
source : Coinmarketcap
Moving on to the charts, they depict a consistent downward trend with Bitcoin starting around $61.26K before facing resistance, resulting in its decline during the day. Despite the hard attempt at price stabilization, the price continued to turn down, reaching a narrow point of approximately $58.77K.
This recent price drop adds to the ongoing volatility in the crypto market, as Bitcoin’s dominance remains at 56.2%, followed by Ethereum at 15.0%. As the market is seeing a high fluctuation in price, investors are closely monitoring these changes and using them to their advantage.
Bitcoin Technical Analysis
Moving on to a more technical aspect, Bitcoin’s price action has recently exhibited signs of a possible reversal as it hovers around $58,723 after hitting a low of $57,681 earlier. The charts portray a complex ABCD pattern, as the lowest wave (E) is indicating a possible end to the downtrend, hinting at a potential recovery.
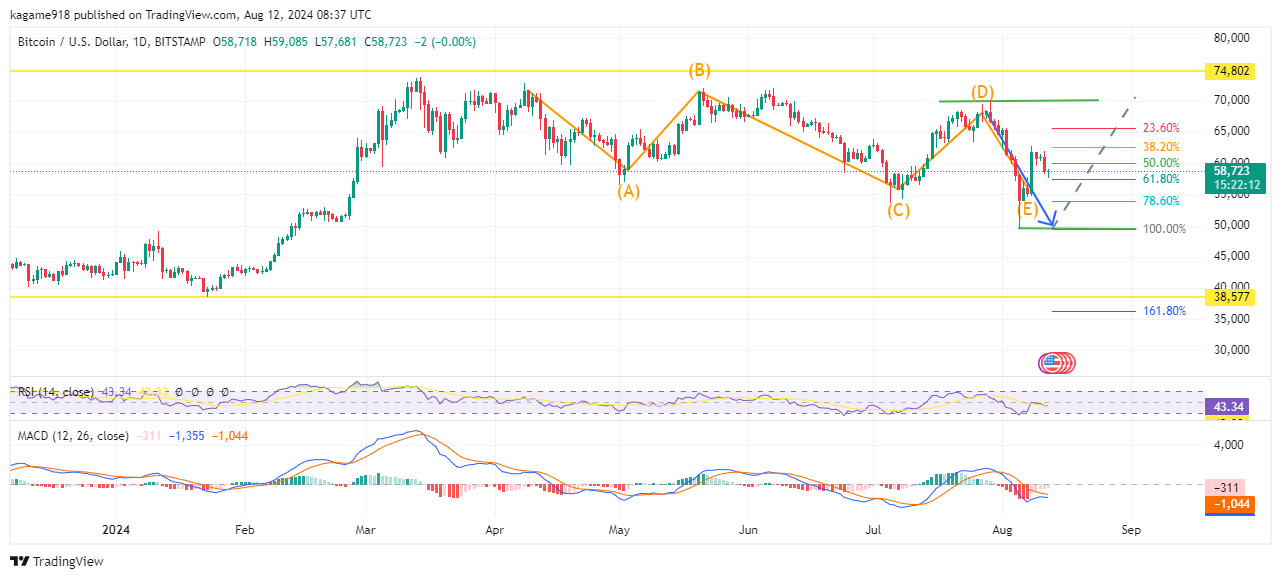
Source: Tradingview
Read CRYPTONEWSLAND onThe resistance level at $74,802 represents the peak wave of B, remaining a barrier that the token needs to overcome to confirm a bullish reversal. The 38.2% Fibbonacci retracement level is at approximately $63,000, aligning with previous price action highs. Furthermore, the RSI indicator is currently at 43.34, which suggests that Bitcoin is in neutral territory but is leaning towards oversold conditions. Both the RSI line and the signal line are moving downward, indicating a more bearish trajectory.
The Moving Average Convergence Divergence indicator shows a bearish crossover, with the MACD line at -1,355 and the signal line at -1,044. The negative hiatogram bars reinforce the current bearish sentiment, and a narrowing gap between the lines could signal a shift in momentum. The chart indicates that the bearish movement might continue at the support levels clearly identified on the chart, with the 161.8% Fibonacci extension at $38,557.
This provides a long-term safety net if the momentum continues.
disclaimer read moreCrypto News Land, also abbreviated as "CNL", is an independent media entity - we are not affiliated with any company in the blockchain and cryptocurrency industry. We aim to provide fresh and relevant content that will help build up the crypto space since we believe in its potential to impact the world for the better. All of our news sources are credible and accurate as we know it, although we do not make any warranty as to the validity of their statements as well as their motive behind it. While we make sure to double-check the veracity of information from our sources, we do not make any assurances as to the timeliness and completeness of any information in our website as provided by our sources. Moreover, we disclaim any information on our website as investment or financial advice. We encourage all visitors to do your own research and consult with an expert in the relevant subject before making any investment or trading decision.