
- Bitcoin apparent demand stayed negative for 208 days and recently reached a cycle low near minus 273,000 BTC.
- Bitcoin held around the $58,500 level twice, despite high volatility and a significant amount of liquidations.
- Positive funding rates persisted while prices weakened, showing leveraged optimism without matching spot demand.
Bitcoin Demand continued under pressure as on-chain data indicated a record low apparent demand, with Bitcoin trading in a volatile range as buyers defended important support levels.
Apparent Demand Remains in Deep Negative Territory
A chart shared by Ali Charts showed Bitcoin apparent demand at minus 273,000 BTC. The metric has stayed below zero for 208 consecutive days. The reading marks the weakest level of the current cycle.
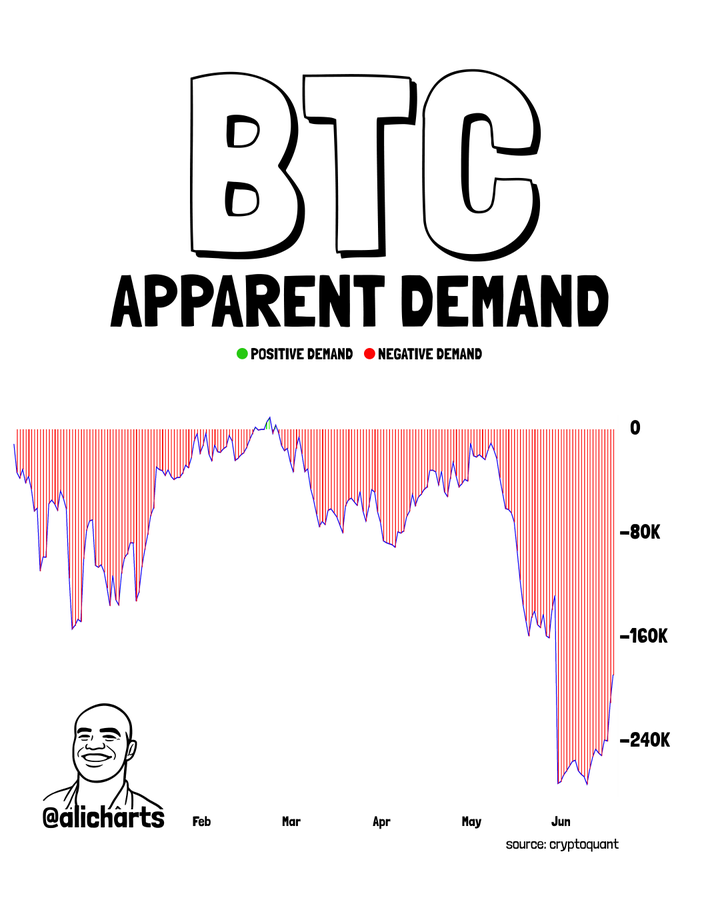
Apparent demand measures spot absorption against newly created Bitcoin supply. It also tracks the movement of older coins returning to circulation. Negative readings indicate selling exceeds fresh market demand.
During November 2025 and May 2026 the indicator ranged between zero and minus 150,000 BTC. A number of recoveries were made in February, March and May. None of those rebounds managed to turn the metric positive.
The latest decline suggests older Bitcoin inventories are entering circulation faster. The indicator has now flattened near record lows. That pattern points to continued distribution rather than broad accumulation.
Bitcoin Price Holds Key Support Near $58,500
Bitcoin during the time of writing, traded at $59,703 after falling 2.93% during the previous day. The price of gold dropped from around $61,500. Selling pressure thereafter surged sharply up.
It dipped briefly to $58,500 in the sell-off. These are usually part of leveraged liquidations and stop-loss cascades. But buyers reacted swiftly to the sell-off.

Bitcoin’s price bounced back into the $59,000 and $59,500 area shortly after.The recovery suggested strong bid-side liquidity below the market. Selling pressure failed to develop into a broader breakdown.
Another wave of weakness later retested the $58,500 area. Buyers again defended the support level successfully. Bitcoin then recovered toward the important $60,000 threshold.
Funding Rates Reflect Persistent Bullish Positioning
Another chart tracked Bitcoin price against open interest-weighted funding rates. The data covered market activity between late October and late June. Funding remained mostly positive despite falling prices.
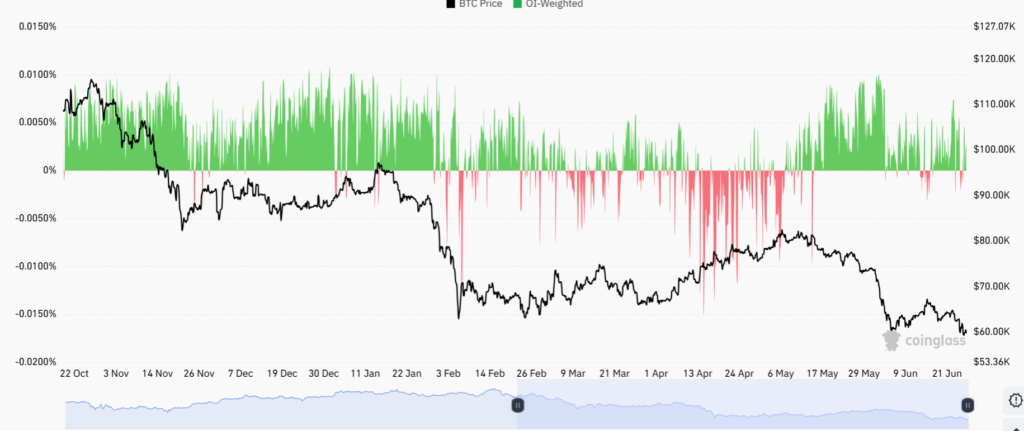
From late October through early January, traders maintained leveraged long positions. Bitcoin prices, however, trended lower during that period. The divergence suggested continued bullish expectations.
Bitcoin fell significantly from its level of approximately $90,000 to approximately $75,000 during February. The funding rate became more erratic and often turned around. Market uncertainty increased as liquidations accelerated.
Funding turned strongly positive again from mid-May through early June. Yet Bitcoin failed to establish sustained upside momentum. The divergence suggested leverage increased faster than genuine spot demand.
