- Bitcoin breaks $64K, supported by strong market trends and technical indicators.
- Critical Fibonacci levels suggest the potential for further gains if resistance is breached.
- MACD crossover and RSI signal strength, but traders should watch for possible downside risks.
BTC continues its upward trajectory, breaking the $64,000 mark with a price of $64,321.86, representing a 5.33% increase within the last 24 hours. This onwards momentum comes after the coin experienced a rise in trade, which ended up pushing its market capitalisation to $1.27 trillion. This has secured Bitcoin as the leading cryptocurrency globally by market capitalisation.
Furthermore, the 24-hour trading volume has also followed the track of the coin’s increase by 67.08%, resulting in its price tag of 43.95. This has, in turn, indicated the robust trading activity witnessed in the market.
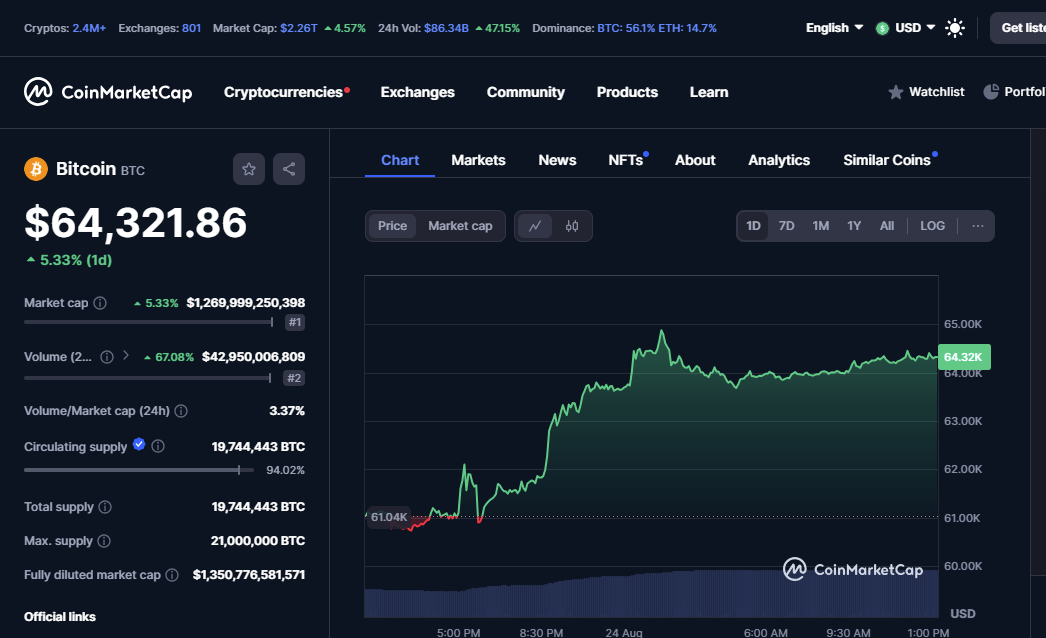
Source : coinmarketcap
The coin’s strong market engagement has also contributed to its high circulating supply, which is currently at 19,744,443 BTC, or 94.02% of the total maximum supply capped at 21 million BTC. Moving to the price charts, a steady climb from $61,040 eventually passed $65,000 before it went on to stabilise around the $64,000 range. This sustained growth suggests strong buying pressure and market confidence in Bitcoin’s continued performance.
Bitcoin Price Action
The token has shown resilience in the face of high market volatility, leading to its current price of $64,198 with a modest 0.18% daily increase.
Moving on with the coin’s price action, the chart pattern showcases an extended XABCD structure, which overall suggests that Bitcoin may be poised for another upward move. After reaching the peak of point A earlier this year, Bitcoin retraced to point D, indicating the potential completion of the pattern.
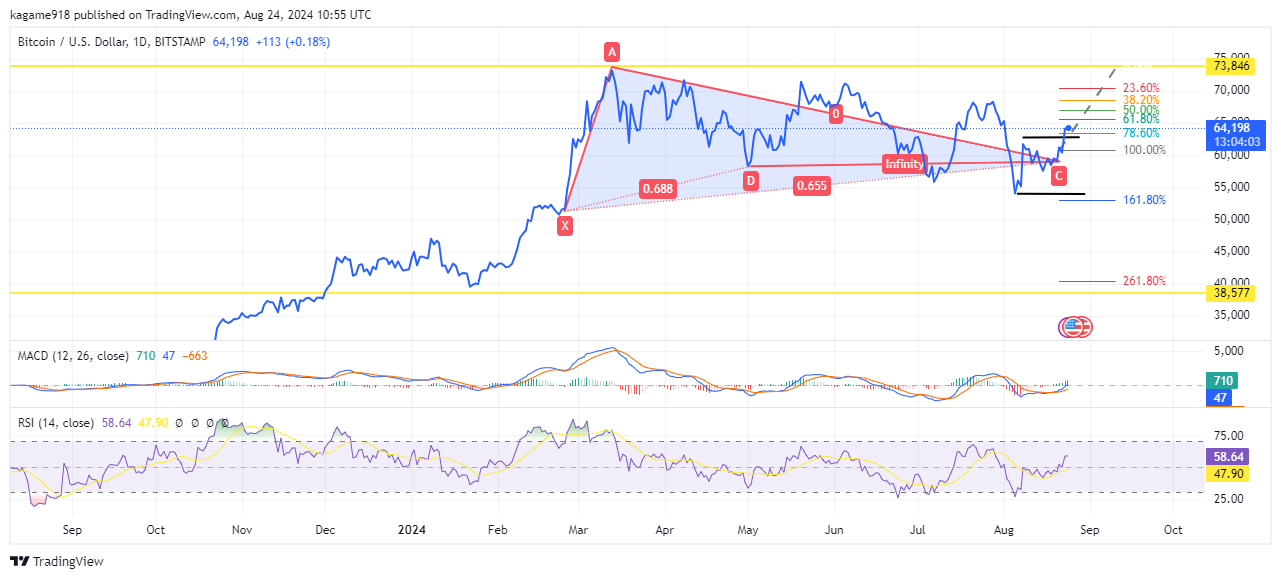
Source : Tradingview
Notably, the Fibonacci levels highlight key areas of resistance and support. The 23.60% retracement at approximately $67,188 and the 38.20% level around $65,208 are crucial zones where Bitcoin might face major selling pressure. If these levels are breached , the next target could be the 50.80% retracement level at $61,808, aligning with the current upward momentum.
The Moving Average Convergence Divergence indicator shows a promising crossover, evident with the MACD line (710) crossing above the signal line (47) signalling a potential reversal. This is also backed by the Relative Strength Index, which currently stands at 58.64, which indicates that Bitcoin is gaining strength without being overbought.
Traders must take caution in the market, as the chart also indicates a potential downside risk. The 161.80% Fibonacci extension level at $38,557 serves as a critical support level. Should Bitcoin fail to maintain its current trajectory, a breach could occur and trigger further downward movement.
